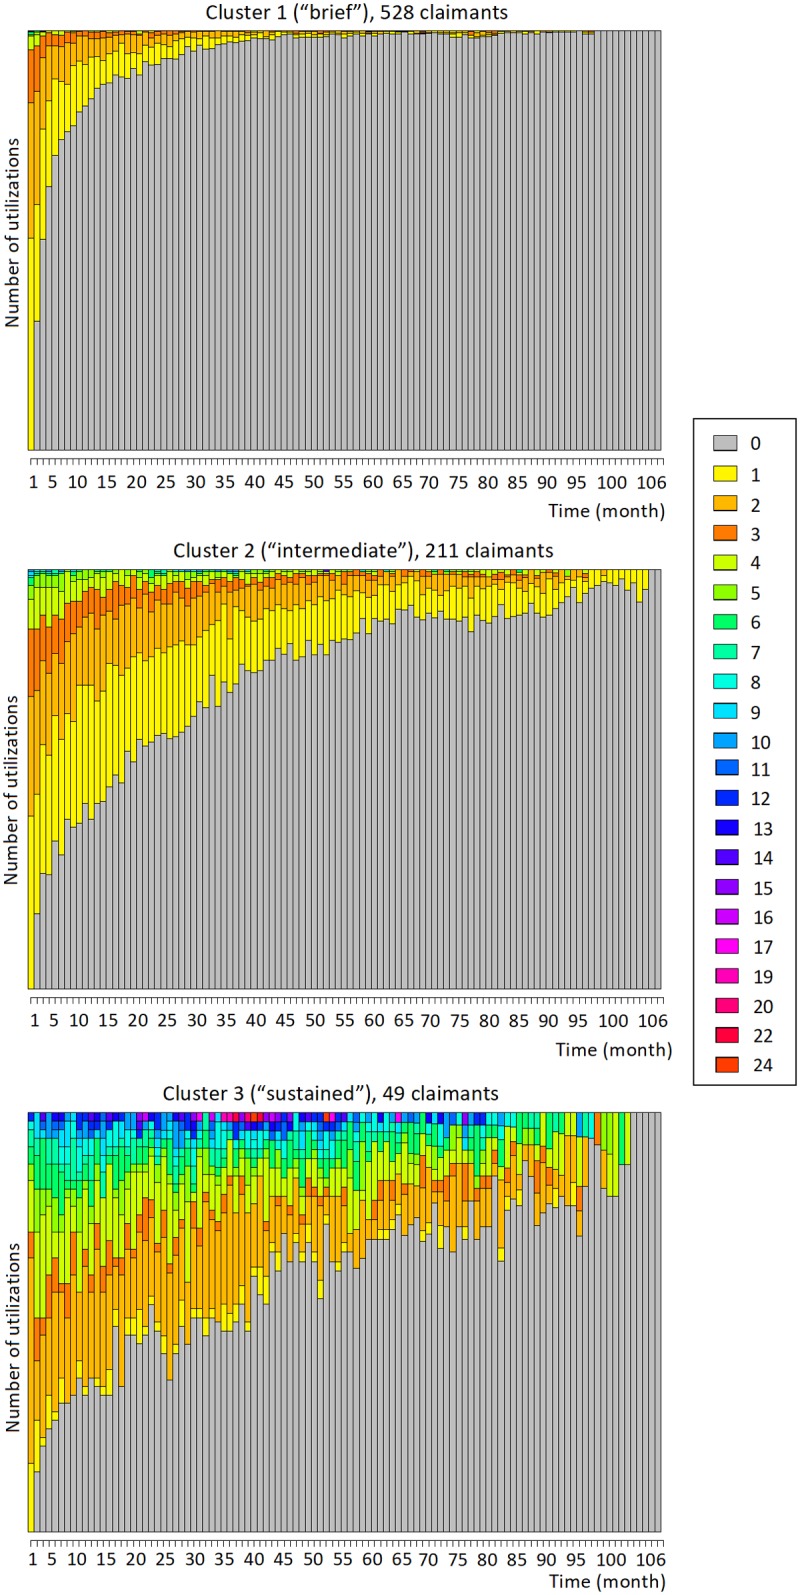
Fig 2. Stacked plots of the number of monthly utilizations of the psychology service for cluster 1 (528 claimants), cluster 2 (211 claimants) and cluster 3 (49 claimants).

Based on the trends in the plots, we qualitatively describe these clusters as “brief”, “intermediate”, and “sustained”.
