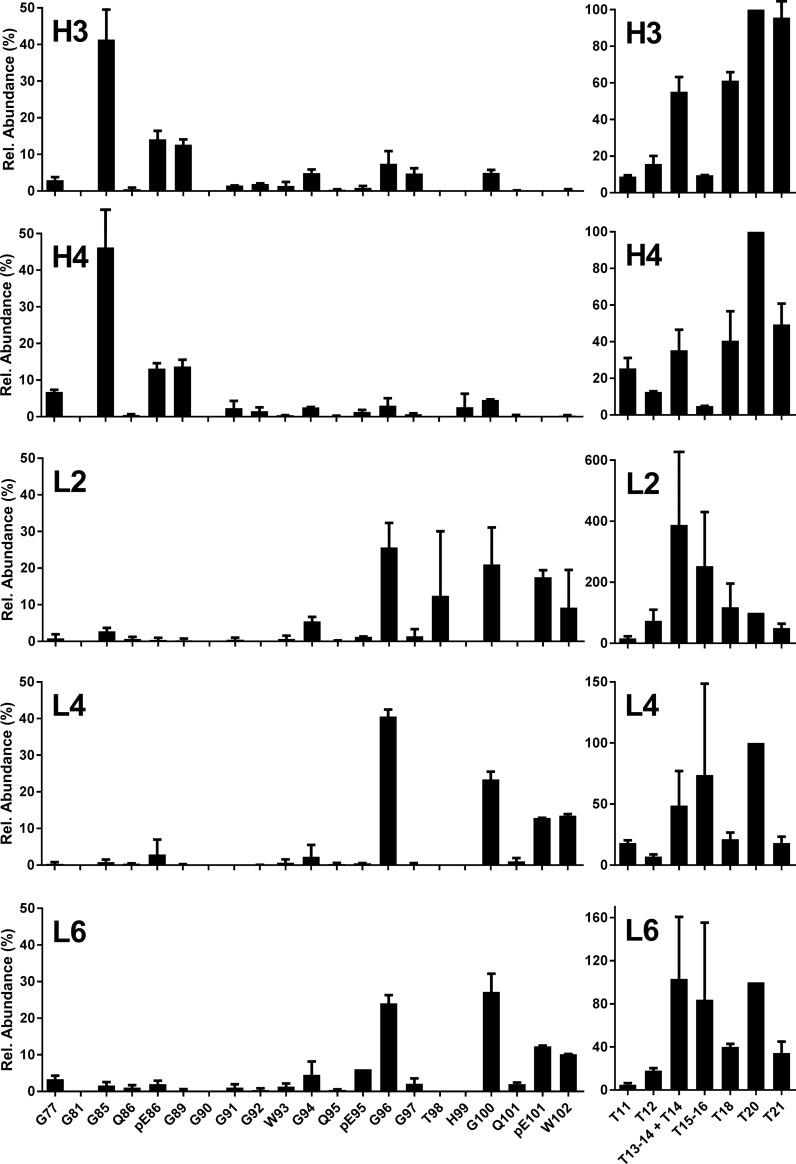
Fig 3. Bovine experimental atypical BSE.
N-TAAP (left-hand panels) and tryptic peptide profiles (right hand panels). H3, H4: H-BSE primary passage cases [37]; L2, L4: L-BSE primary passage cases [37]; L6: L-BSE secondary passage case [38]. Samples (350 mg) were divided into two replicates prior to PK treatment and processed and analysed in parallel (TEmax = 7 mg), then data combined to create the profiles. Where error bars exceeded the maximum of the y-axis range displayed, they were clipped by the software and drawn in manually.

