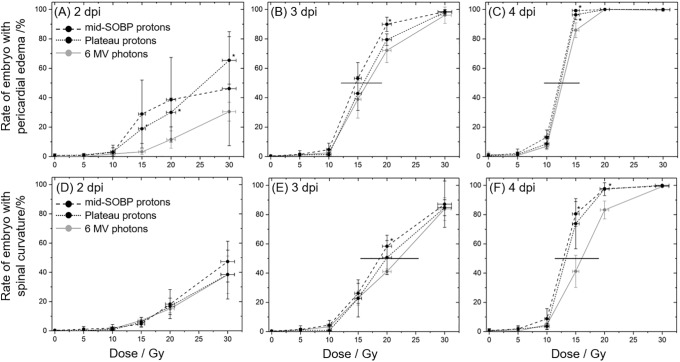
Fig 4. Radiation quality and dose dependent malformation rates.
Time and dose dependent development of pericardial edema (A-C) and spine curvature (D-F) for zebrafish embryo irradiation with 6 MV photons (grey), proton plateau (black, dotted) and mid-SOBP position (black, dashed). Error bars represent the standard deviation of three independent experiment; statistical significant difference to the photon reference is indicated by * (p<0.05). Horizontal lines in the plots at 3rd and 4th dpi are shown to illustrate the differences in dose to induce 50% effect rate.

