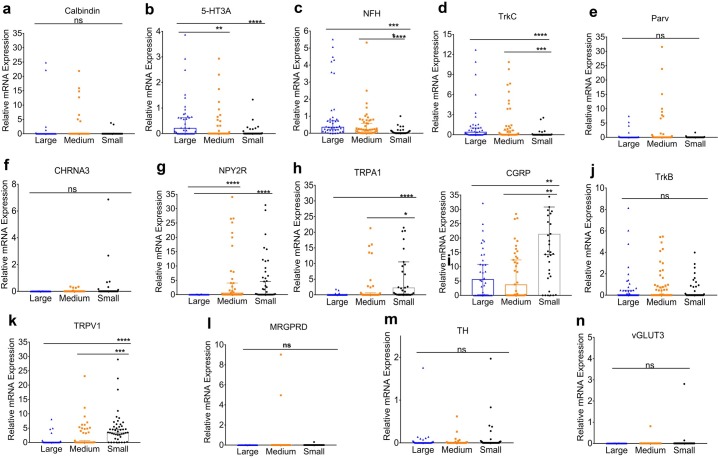
Fig 3. Intensity of expression of target genes based on sensory neuronal cell size.
Relative mRNA expression values from single-cell PCR for each gene are presented as median +/- 95% confidence interval in large, medium and small neurons. Expression intensities for each gene was compared using parametric one-way ANOVA with Bonferroni post-hoc test, if the variances in means were not significant. If significant, non-parametric Kruskal-Wallis with Bonferroni post hoc test was used. p<0.05 was considered significant.

