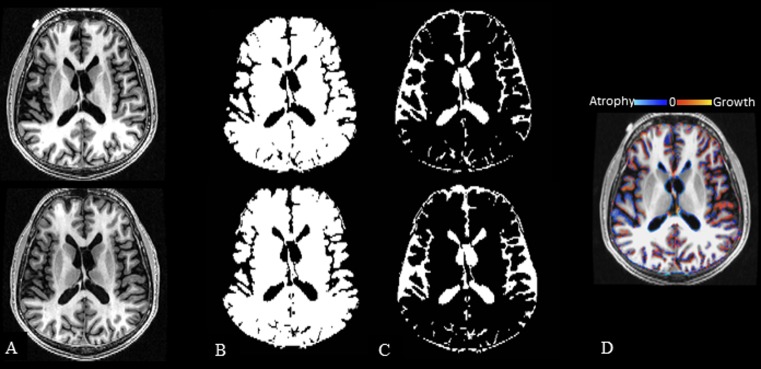
Fig 1. Two fully automated segmentation pipelines used to determine change in whole brain volume.
3T T1-weighted modified driven equilibrium Fourier transform pulse sequence–reformatted axial images. Panels A-C show baseline images in the top row and follow-up images in the bottom row. A: source images; B/C: SPM12 tissue class segmentation maps (brain parenchyma–B, CSF–C), used to calculate brain parenchymal fraction (BPF). Panel D shows a sample SIENA percentage brain volume change (PBVC) map comparing baseline to follow-up images from this anatomic section. Images are from a 51-year-old man with relapsing-remitting multiple sclerosis at baseline and 4.5 years later; baseline disease duration = 30.1 years; baseline/follow-up Expanded Disability Status Scale score = 0/0, timed 25-foot walk = 5.0/4.0 seconds, and BPF = 0.802/0.798. PBVC was -0.9% (decreased) over the study period. SPM12 = statistical parametric mapping, v. 12; SIENA = structural image evaluation, using normalization, of atrophy, v. 5.0 (see Methods section for details).

