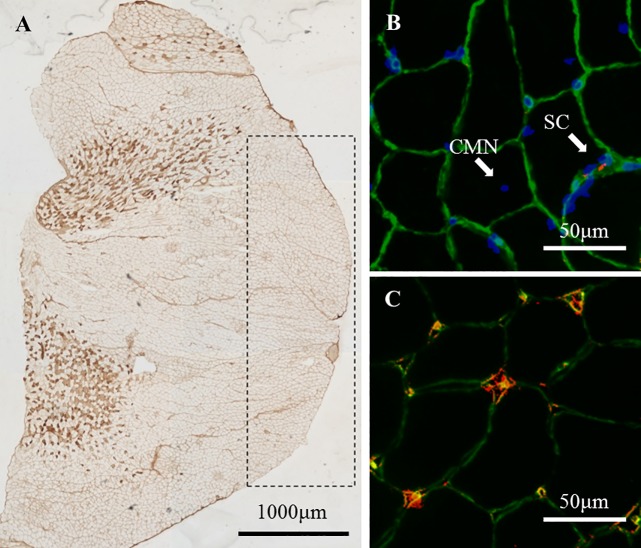
Fig 1.
Images for MHC-IIa (A), satellite cells (B), central myonucleus (B), and capillaries (C) in the gastrocnemius. (A): Stained fibers represent MHC-IIa, and the area surrounded by the dashed line is the superficial portion of the gastrocnemius. (B) Image representing the basal lamina (green), myonucleus (blue), and satellite cells (red). White arrows indicate satellite cells (SCs) or central myonucleus (CMN). (C) Image representing co-localization of capillaries detected by laminin (green) and CD31 (red).

