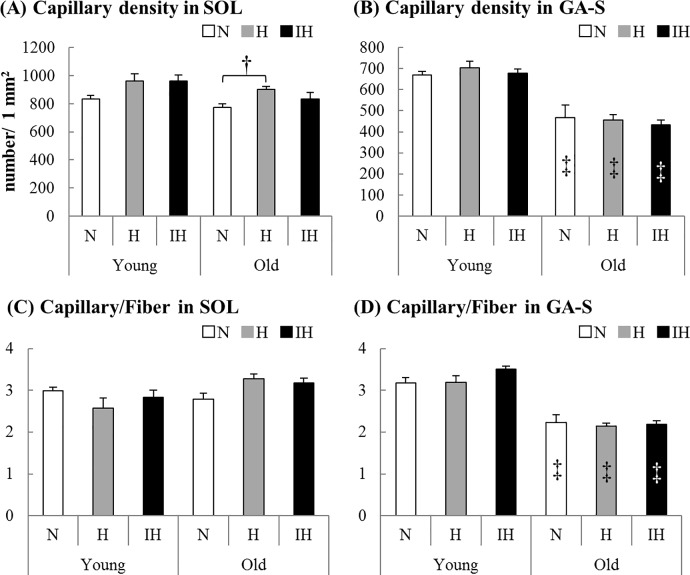
Fig 3.
The capillary density (number/ 1 mm2) and capillary-to-fiber ratio of the soleus (A, C) and superficial portion of the gastrocnemius (B, D) muscles in each experimental group of young and old mice (N: white bar, H: gray bar, IH: black bar). Values are the mean ± SE. †: Significant difference from each N group (P < 0.05). ‡: Significant difference from young mice in each group (P < 0.05). The capillary density (A) was higher in the old soleus muscle of H groups than of N groups (P = 0.022). In old gastrocnemius muscles, capillary densities (B) and capillary-to-fiber ratios (D) in all groups were lower than those in young mice [capillary densities: N (P = 0.049), H (P = 0.001), IH (P = 0.001), capillary-to-fiber ratios: N (P = 0.001), H (P = 0.001), IH (P = 0.001)].

