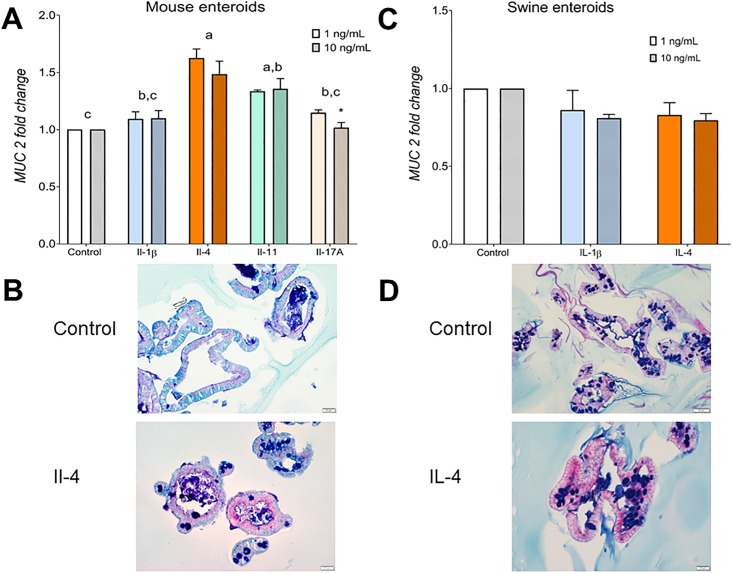
Fig 2. Mucin 2 gene expression (A) and presence of goblet cells shown by staining with periodic acid-Schiff with Alcian blue (B) of mouse and swine enteroids (C and D) treated with different interleukins at 1 and 10 ng/mL concentration for 24 h.
N = 3 independent experiments. Data are presented as mean ± standard error of the mean, normalized to the respective experimental control. Dietary treatment groups with different superscripts are different (P > 0.05). Asterisk (*) indicates different to Il-4 when treated with 10 ng/mL of Il-17A.

