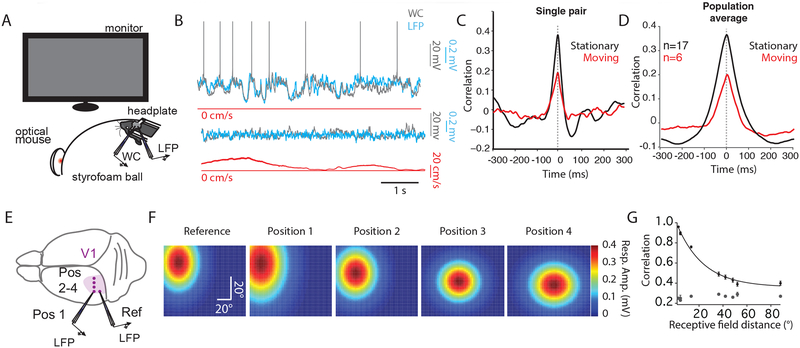
Figure 1: The spatial extent of correlated activity in the visual cortex of awake, behaving mice.
(A) Schematic illustrating experimental set-up.
(B) Simultaneous WC (gray), and LFP (cyan), and speed (red) recordings during stationary (upper) and moving (lower) epochs. LFP is inverted for display purposes.
(C) Cross-correlogram for the pair in (B) for stationary (black) and moving (red) epochs. Dotted line represents zero lag for (C) and (D).
(D) Averaged cross-correlogram for 17 WC/LFP pairs during stationary epochs (black). In 6 of these pairs, moving epochs were also measured (red).
(E) Cartoon illustrating the pattern of craniotomies in V1 used for LFP-LFP experiments.
(F) 2D Gaussian fits to receptive field maps for LFP position marked in (E). Color legend is depicted on the right.
(G) Relationship between Pearson’s r and receptive field distance in degrees. Gray dots represent shift-predicted correlation values.

