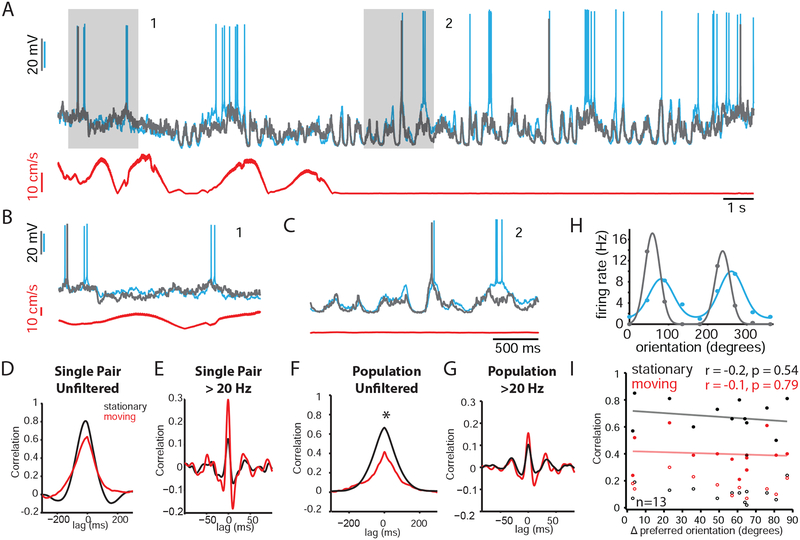
Figure 2: Spontaneous membrane potential correlations are independent of stimulus preference.
(A) Two simultaneous WC current clamp recordings (cyan and gray), together with a speed trace (red). Gray boxes highlight a moving (1) and stationary (2) epoch expanded in (B) and (C), respectively.
(B) Expanded timescale for moving epoch (1) highlighted in gray in (A).
(C) Expanded timescale for stationary epoch (2) highlighted in gray in (A).
(D) Cross-correlogram for pair shown in A-C. Black and red traces represent analysis for stationary and moving epochs, respectively. The same color scheme is used in E, F, G, and I.
(E) Cross-correlogram for pair in (A) after high-pass filtering the signals at >20 Hz.
(F) Population average (n=13). Black bar represents region of significant statistical difference
(G) Population average (n=13) for analysis in (E).
(H) Tuning curves for cells shown in (A).
(I) Pearson’s r for unfiltered (solid symbols) and filtered > 20 Hz (open symbols) as a function of tuning disparity during stationary (black) and moving (red) epochs. Neither moving nor stationary correlation exhibited a significant correlation with tuning disparity (r = −0.2, p = 0.54 for stationary unfiltered; r = −0.1, p = 0.79 for moving unfiltered; r = −0.08, p = 0.79 for stationary filtered; r = −0.23, p = 0.48 for moving filtered; n = 13).

