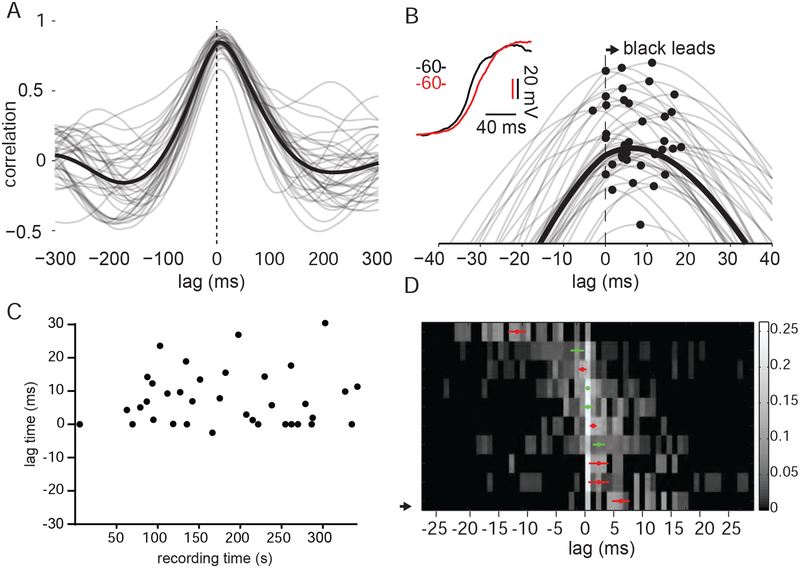
Figure 3: The sign of Vm lag between pairs of L2/3 neurons is preserved over time.
(A) Vm CCG for a pair of L2/3 neurons computed with 2 s segments during epochs of quiet wakefulness. Single trial CCGs are displayed in gray; mean CCG is displayed in black.
(B) Expanded timescale highlighting CCG offset from zero in (A). Peak of the CCGs are marked with filled black circles.
(C) CCG offsets plotted over recording time for pair in (A) and (B).
(D) Heat map representing CCG offsets for population of 10 pairs. Each row is a probability distribution of CCG offsets for one pair. A small number of trials had offsets larger than 30 ms and are not displayed. The median CCG offset for each pair is marked by a red circle for those distributions significantly different from zero and green open circles for those that are not. Error bars reflect the standard error of the mean. (solid, significantly different from zero; open, not significantly different from zero).

