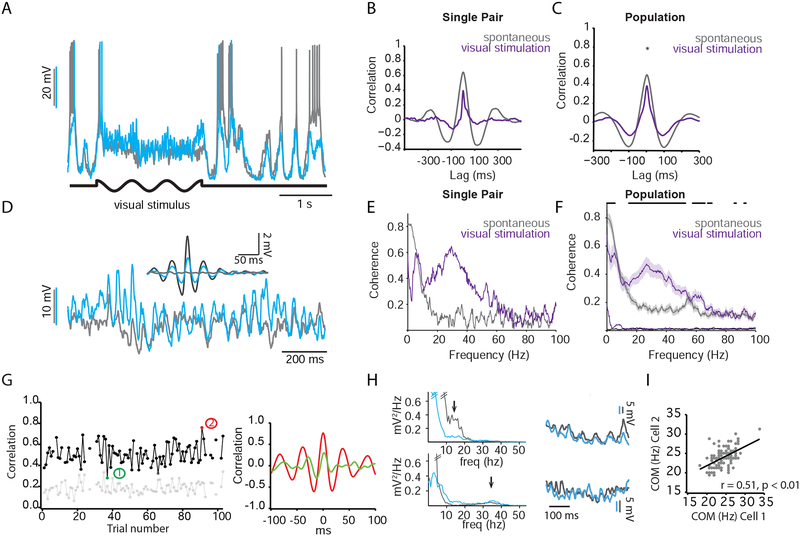
Figure 5: Visual stimulation generates high-frequency correlations and preserves sign of Vm lag between pairs.
(A) Dual current clamp recordings from L2/3 pyramidal neurons. Black trace denotes epoch of visual stimulation.
(B) Cross-correlogram between pair of neurons during spontaneous (gray trace) and visual stimulation (purple trace) epochs for the pair in (A)
(C) Same as (B) for population, n=10. * denotes significance for statistical comparison at zero lag.
(D) expanded timescale taken from epoch of visual stimulation in (A). Inset, fluctuation-triggered (> 2.75 mV) averaging of band-passed (15–50 Hz) traces.
(E) Coherence plotted as a function of frequency for spontaneous and visual stimulation epochs in (A).
(F) Same as (E) for population.
(G) Vm correlations during visual stimulation are plotted across trials. Gaps represent moving trials, which were omitted from the plot. Light gray trace represents the shuffled correlation obtained by computing the cross correlogram between trial n from cell 1 and trial n+1 from cell 2. Right, example cross correlograms from trials (1) and (2) highlighted in plot on left.
(H) Power spectra for two example trials are displayed (top and bottom). Arrowheads denote relative peaks in these spectra seen in these two trials, the first at ~15 Hz and the second at ~35 Hz. Right, example waveforms from the trials used to generate spectra on left.
(I) The frequency center of mass (COM) for power in the beta frequency band (15–40 Hz) for cell 2 plotted against the COM for cell 1.
See also Figure S2.

