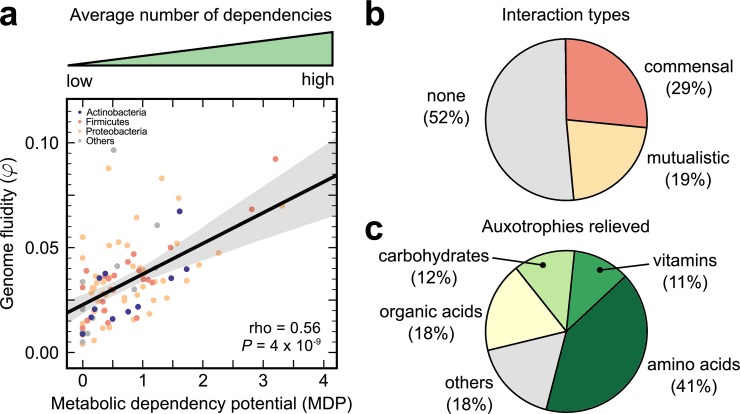
Fig 2. Conspecific metabolic dependencies scale with accessory genome content.
a, Scatter plot of genome fluidity φ versus conspecific metabolic dependency potential (MDP) for the 96 prokaryotic species in this study. Each point represents the average number of dependencies detected per strain per condition across all conspecific pairs for one species. Colours represent each species’ phylum-level taxonomic identity. The solid black line represents a linear regression and the gray envelope around it, the 95% prediction interval. rho corresponds to Spearman’s nonparametric correlation coefficient and the P value to a one-way asymptotic permutation test for positive correlation. b, Pie chart of the types of interactions detected in each conspecific pair. c, Pie chart of the types of auxotrophies that the detected dependencies relieve due to pairwise growth. Each of the 137 precursors belongs to a unique chosen category (S4 Table).

