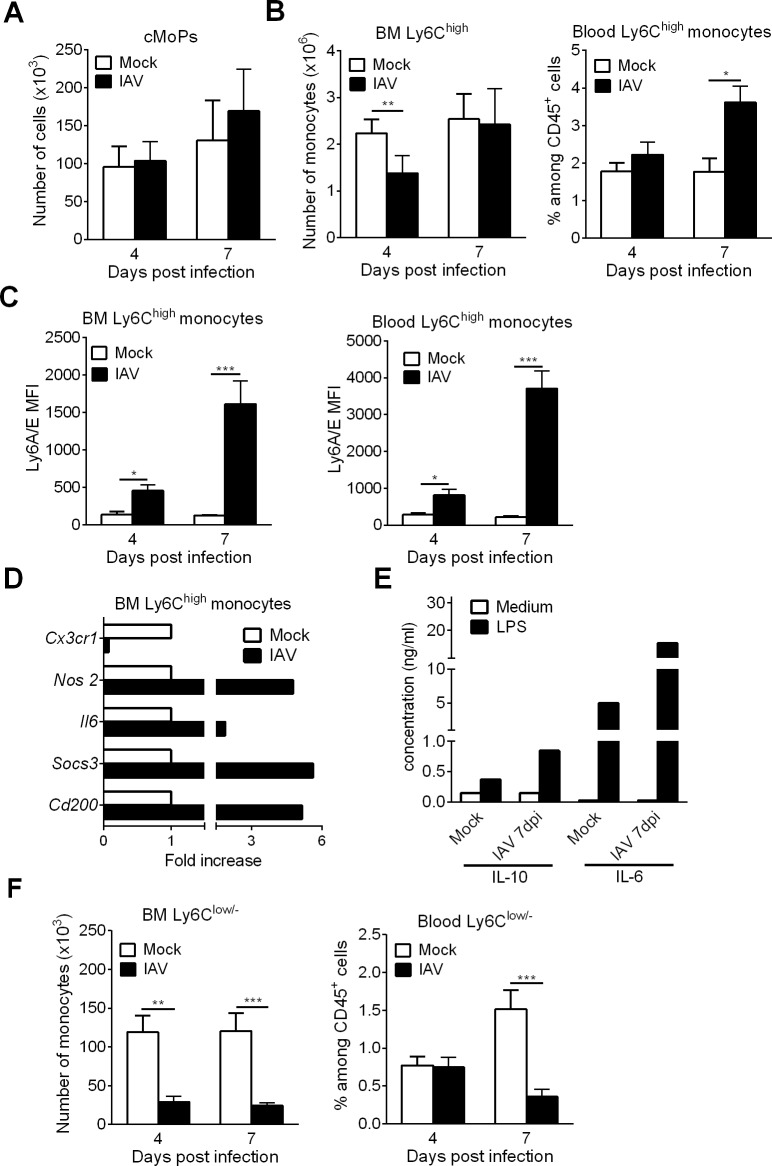
Fig 5. Influenza A virus infection increases monopoiesis in the BM.
(A-C) Mock-treated and IAV-infected mice were sacrificed at 4dpi and 7dpi. (A) The absolute number of BM cMoPs was quantified by flow cytometry. Means ± SEM of biological replicates from two experiments are represented (n = 6). (B) The absolute number of BM CD115+Ly6C+ monocytes (left panel) and the frequency of blood BM CD115+Ly6C+ monocytes (among CD45+ cells) (right panel) were assessed by flow cytometry. Data were pooled from three experiments (n = 9). (C) The mean of fluorescent intensity (MFI) of Ly6A/E expression on BM and blood Ly6C+ monocytes was analyzed. Data were pooled from two experiments (n = 6–7). (D-E) Ly6Chigh monocytes were FACS sorted from BM (pool of 3 mice) of mock-treated and IAV-infected animals (7dpi). (D) mRNA copy numbers of pro- and anti-inflammatory genes were determined by quantitative RT-PCR. Data are normalized to expression of Gapdh and are expressed as fold increase over average gene expression in mock animals. Data represent the means ± SEM of biological replicates (n = 2) (E) Purified monocytes were cultured for 24h with LPS (100ng/ml) and cytokine production was quantified by ELISA. Means of biological duplicates are shown. (F) The absolute number of BM CD115+Ly6Clow/- monocytes (left panel) and the frequency of blood BM CD115+Ly6Clow/- monocytes (right panel) were assessed by flow cytometry. Means ± SEM of biological replicates from three experiments are represented (n = 9). *, p < 0.05; **, p < 0.01; ***, p < 0.001.

