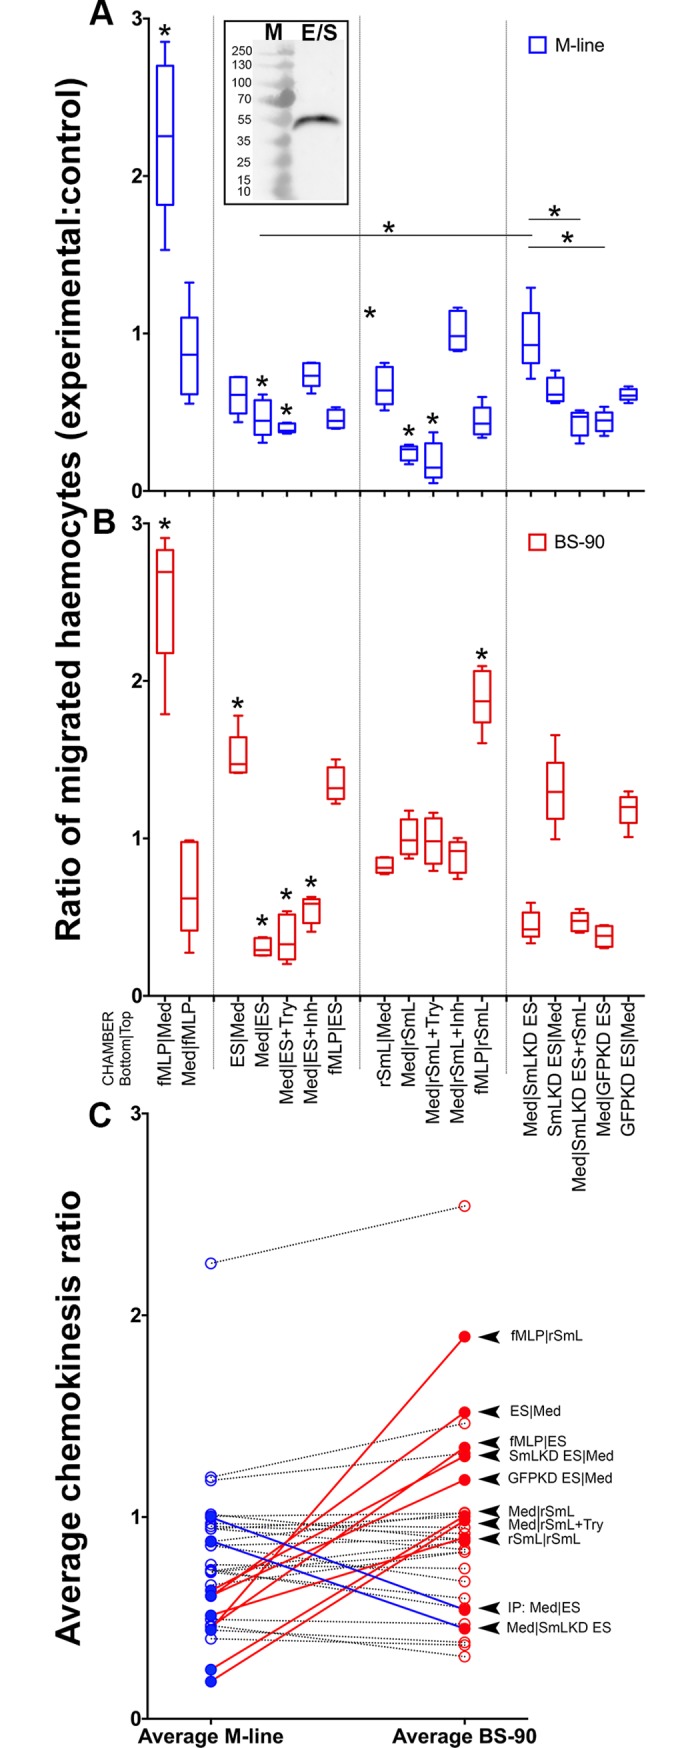
Fig 4. Recombinant SmLeish interferes with M-line B. glabrata haemocyte motility.

Directional migration of M-line and BS-90 haemocytes across a 5μM porous membrane was assessed to determine the impact of rSmLeish on haemocyte motility. Migration is presented as a ratio comparing the number of haemocytes that have migrated to the underside of the membrane in an experimental group to a control group (medium only in both upper and lower chambers) where both haemocyte groups originate from the same snail. fMLP was used as a positive control. (A) S. mansoni excretory/secretory (ES) products (which are shown to contain SmLeish in the inset Western blot) inhibit migration of M-line haemocytes across the membrane when incubated with the haemocytes in the upper well. Recombinant SmLeish (rSmL) inhibits migration of M-line haemocytes across the membrane when incubated with the haemocytes in the upper chamber and this effect was slightly enhanced by pretreatment of rSmL with trypsin (Try). Knockdown of SmLeish prior to generation of ES products abrogated the negative impact of ES products on M-line haemocyte migration and the effect was rescued by addition of rSmLeish to the SmLeish KD ES products. (B) E/S products are attractive to BS-90 haemocytes when in the lower well. rSmLeish had no impact on BS-90 haemocytes and was not attractive to BS-90 haemocytes. Knock down of SmLeish in larval E/S products did not abrogate the attractive nature of E/S products to BS-90 haemocytes. * represents significant difference in haemocyte migration between a treatment and its corresponding control group, or to a specific control as indicated by a solid line. (C) Comparison of the mean values in each treatment between M-line and BS-90 B. glabrata haemocytes identified 10 treatments that yielded significantly different results. A value above 1 indicates migration across the membrane greater than control, a value less than 1 indicates less migration than control. Each treatment is connected between the M-line and BS-90 datasets to aid in visualizing the differences between the different snail haemocytes. A red line indicates that the treatment identified on the left induced more migration in BS-90 haemocytes than M-line, a blue line indicates more migration in M-line haemocytes than BS-90.
