
Figure 3.
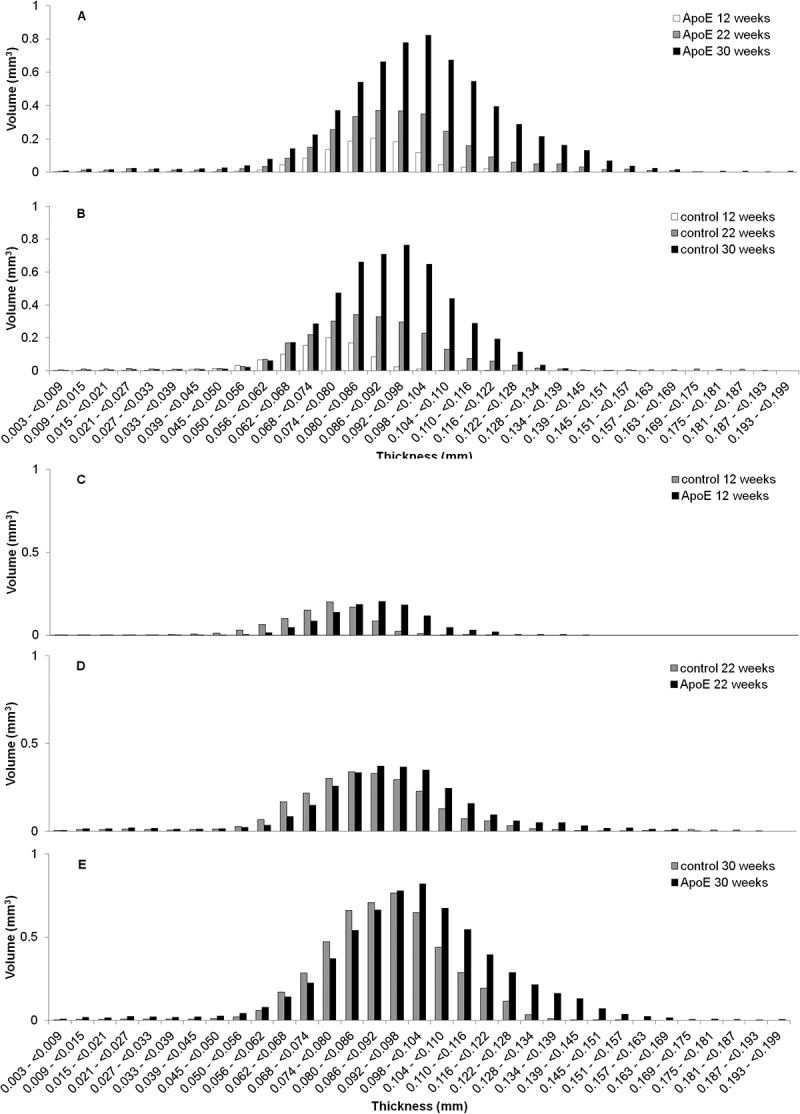
Distribution vascular wall thicknesses throughout the length of descending thoracic aorta. The distributions presented are pooled from all the specimens within either the ApoE or control groups. Within strain, between time points: A) ApoE and B) Control (CTL) at 12, 22, and 30 weeks. Between strain, at each time point: C) 12 weeks, D) 22 weeks, E) 30 weeks (*,p = 0.02).