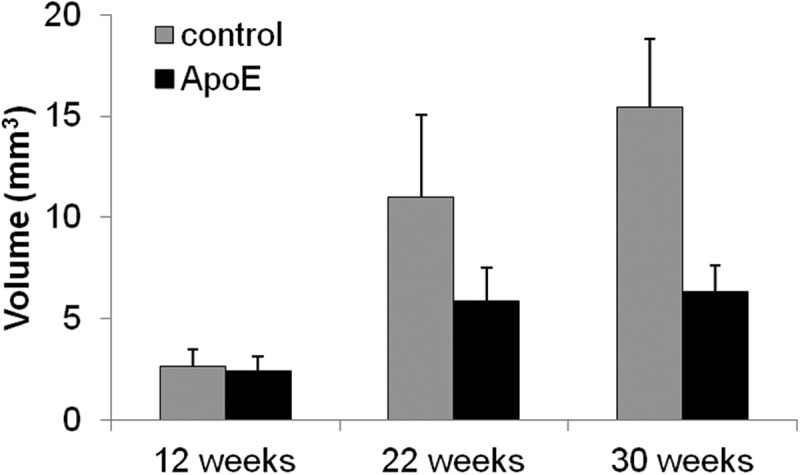
Figure 4.

Overall aorta PVAT volume for the control and ApoE groups over time. When comparing within strain, the control trends towards a steadily increasing aorta PVAT volume with age (p = 0.08, shaded bars only). When comparing between strains, the ApoE (6.69(5.89–7.17) mm3) had significantly less aorta PVAT when compared to control (16.1(14.8–16.8) mm3) at 30 weeks (*,p = 0.02).
