
Figure 1.
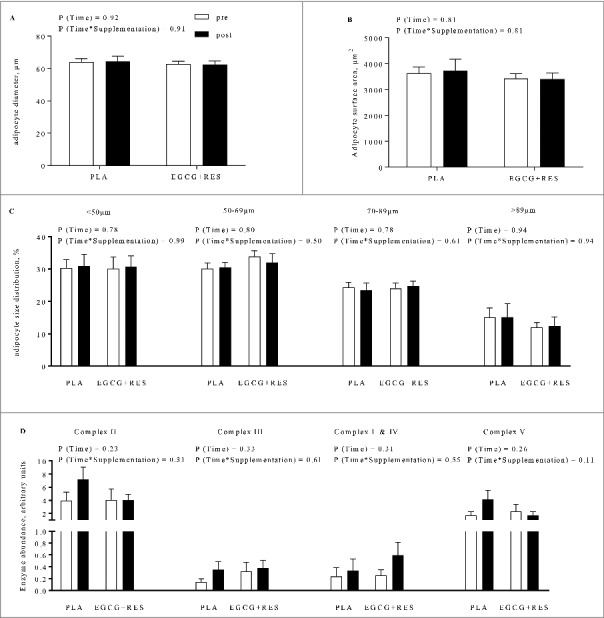
Abdominal subcutaneous adipocyte morphology and OxPhos protein expression before and after intervention. A) Mean adipocyte diameter, B) surface area, and C) adipocyte size distribution, and D) mitochondrial protein content of complexes I-V (complex II: succinate-dehydrogenase, III: ubiquinol-cytochrome C reductase, I&IV: NADH-dehydrogenase & cytochrome C oxidase, and V: ATP-synthase) were not affected by EGCG+RES supplementation compared with PLA. Open bars: week 0; solid bars: week 12. Statistical significance of time and time*supplementation interaction is indicated as P. Values are given as means ± SEM (EGCG+RES, n = 5; PLA n = 9).