
Figure 2.
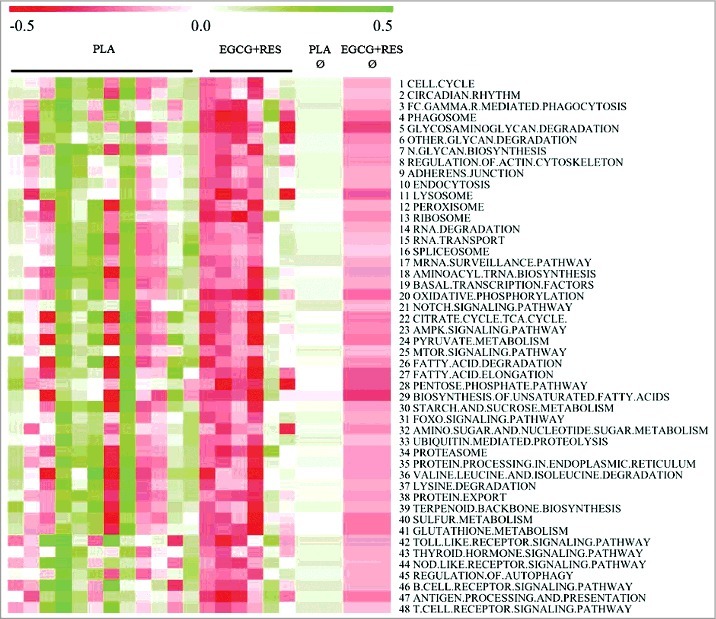
Adipose tissue gene expression changes by intervention. Gene set enrichment analysis (GSEA) of adipose tissue micro-array data revealed that gene sets (Kyoto Encyclopedia of Genes, Genomes, Wikipathways, and Biocarta database) related to cell turnover (1-19), energy and substrate metabolism (20-40), inflammation and the immune system (41-48) were significantly downregulated following EGCG+RES supplementation (PLA, n = 12; EGCG+RES, n = 6, data are first presented by individual and in the last two columns as average per group). Red color indicates downregulated pathways, whereas green color indicates upregulated pathways after EGCG+RES versus PLA. Functional data analysis was based upon FDR q-value <0.05 on the filtered data set (interquartile range > 0.2 (log2), intensity >20 on at least 5 arrays, >5 probes per gene) for the interaction (EGCG+RES versus PLA) with GSEA which was run with 1000 permutations.