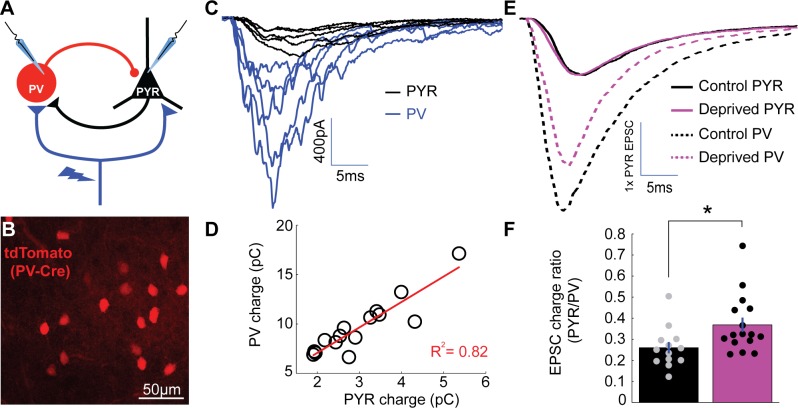
Figure 4. Enhanced depression at thalamocortical synapses onto PV+ interneurons following brief MD.
(A) Whole-cell recordings were obtained from pairs of pyramidal neurons (black) and nearby PV+ interneurons (blue) within V1m while stimulating local ChR2-mCherry+ thalamocortical axons (red). (B) PV+ interneurons were targeted by reporter (tdTomato) expression. (C) Representative example traces from a pyramidal and PV pair while stimulating thalamocortical axons at a range of stimulus intensities, with pyramidal traces in black (PYR) and PV+ interneuron traces in blue (PV). Note the larger thalamocortical EPSCs in the PV+ interneuron compared to the pyramidal neuron. (D) Charge of thalamocortical EPSCs in the pyramidal neuron plotted against corresponding thalamocortical EPSCs in the PV+ interneuron. Linear fit plotted in red (R2 = 0.82). (E) Averaged traces from all pairs (control in black and deprived in magenta) normalized to pyramidal EPSC peak amplitude. (F) Evoked thalamocortical EPSC charge ratio (PYR/PV) for control (black) and deprived (magenta) pairs (control n = 13 pairs, deprived n = 16 pairs, from 13 animals; p = 0.0103, Wilcoxon rank sum test).


