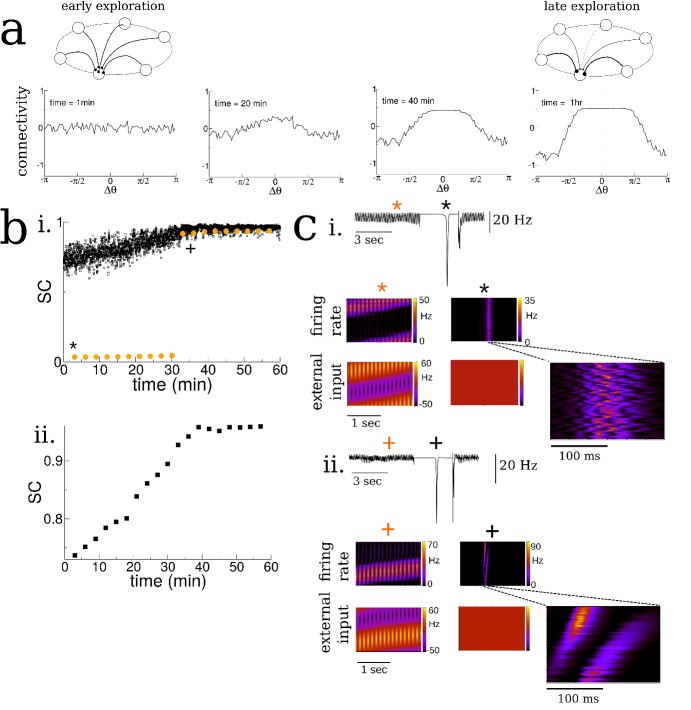
Figure 2. Spatial exploration gives rise to plasticity-dependent emergence of spatio-temporal structure in spontaneous activity.
(a) Snapshots of the connectivity during the exploration of a novel environment. During early exploration, the connectivity is not correlated with the place-field ordering, while during late exploration cells with neighboring place-fields are more strongly connected. (b) i. The mean cross-correlation of the activity of place cells with adjacent place fields on a novel track during exploration (sequential correlation SC). Black: SC during active exploration (theta-activity), Orange: SC during spontaneous bursts. Note the sharp transition in the SC of burst activity. ii. The SC of the total activity binned into 3 min intervals shows a steady increase preceding the transition. (c) Burst activity exhibits replay after a critical period. i. Early exploration. Top: average input to place cells before (blue star), during (black star) and after period of ‘quiet wakefulness’. Bottom: space-time plots of the place cell input and firing rate. Note the disordered spatio-temporal structure of the burst activity. ii. Later exploration. After a critical transition time bursts exhibit sequential replay of activity from the novel track. Note the sequential structure of the burst activity.
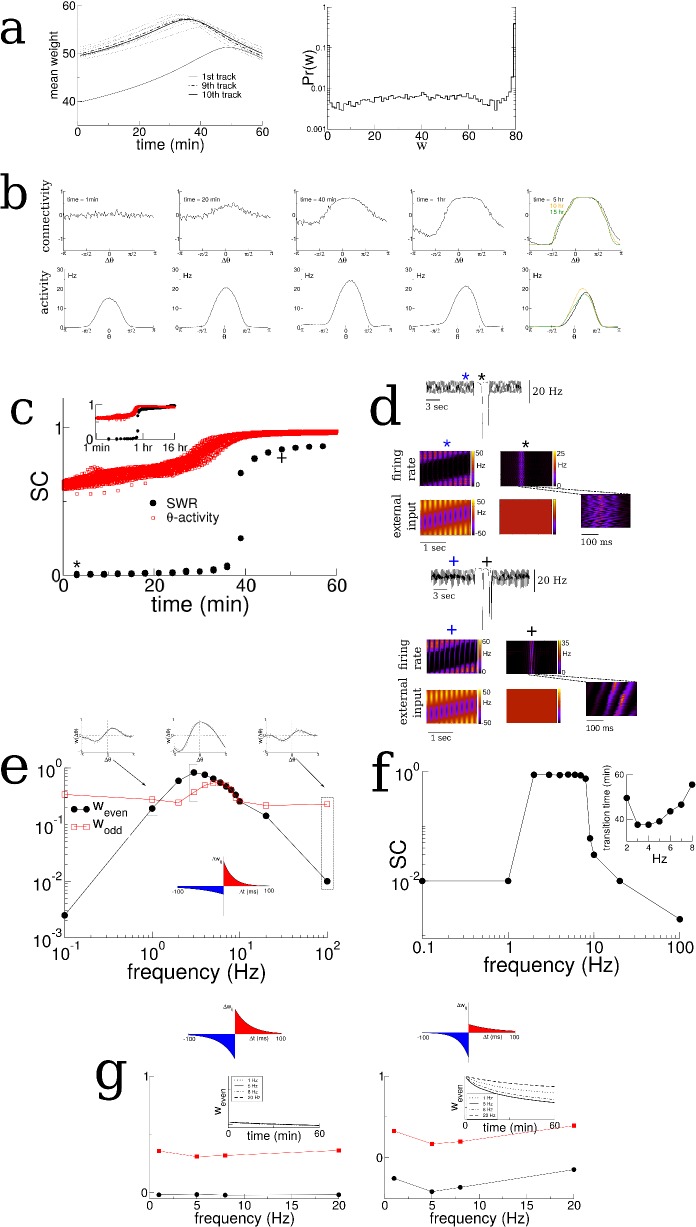
Figure 2—figure supplement 1. The evolution of the recurrent connectivity during exploration of 10 distinct tracks.
Figure 2—figure supplement 2. The emergence of replay for unidirectional motion.
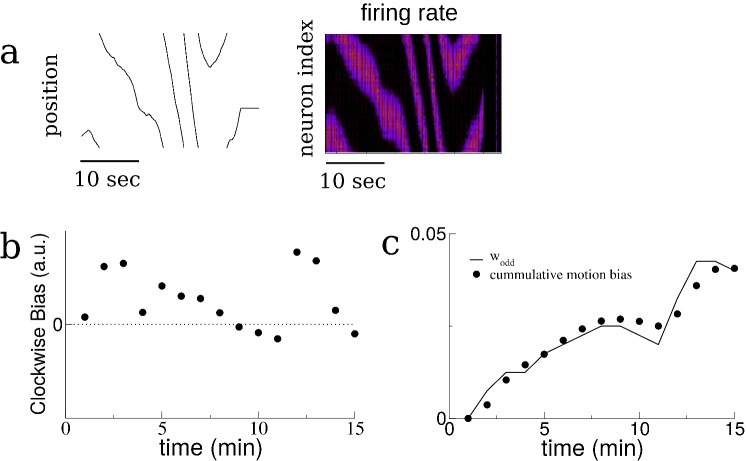
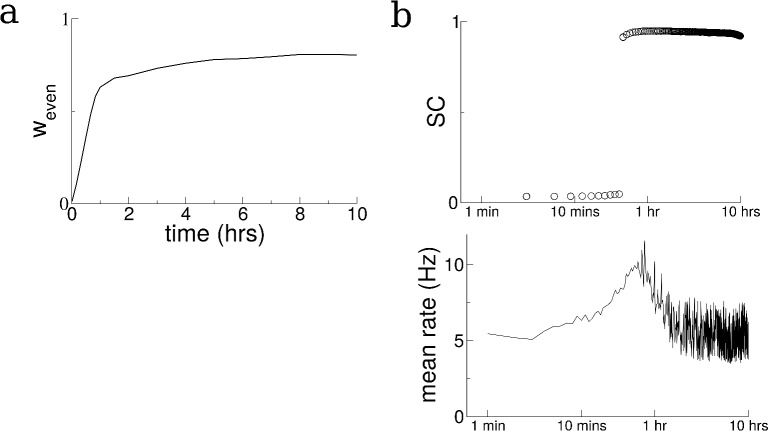
Figure 2—figure supplement 3. The growth of the odd mode of the recurrent connectivity is determined by the bias in the motion of the virtual animal.
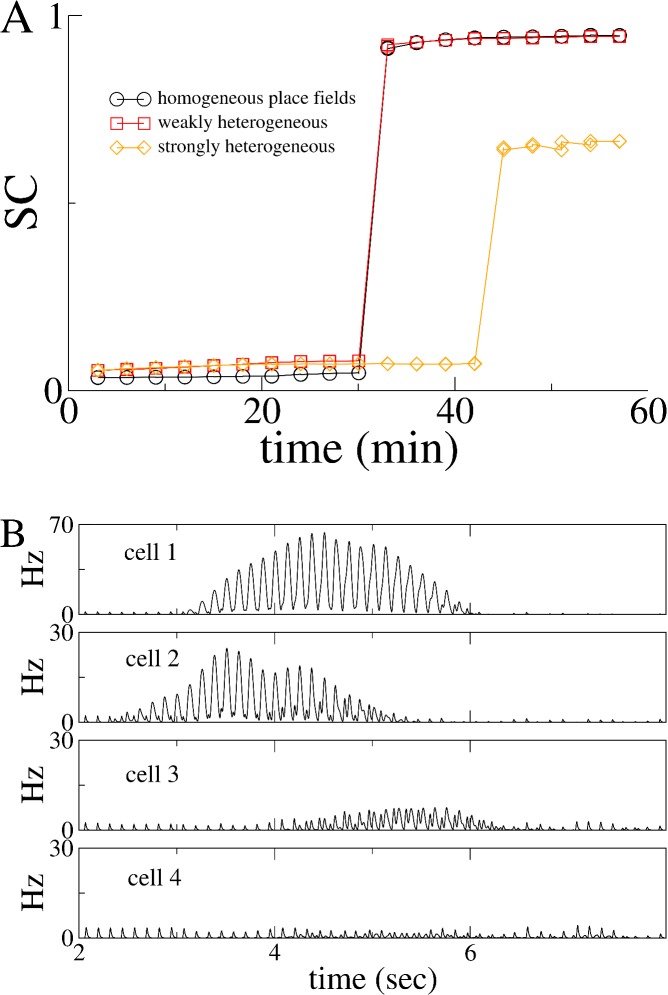
Figure 2—figure supplement 4. Heterogeneity in place-cell activity does not qualitatively alter the transition to replay.
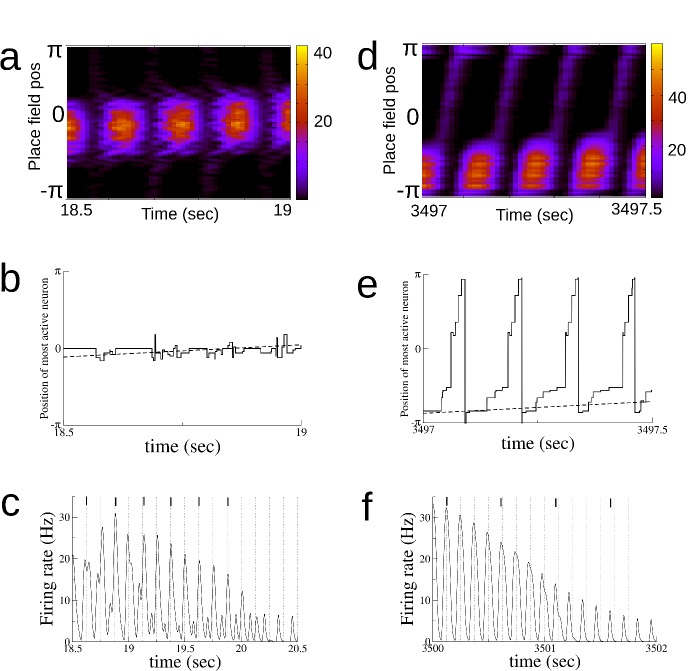
Figure 2—figure supplement 5. Theta sequences and phase precession emerge over time.
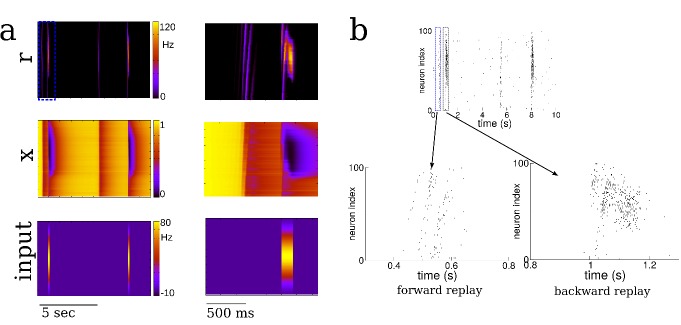
Figure 2—figure supplement 6. Forward replay occurs spontaneously, but backward replay requires location-specific input.
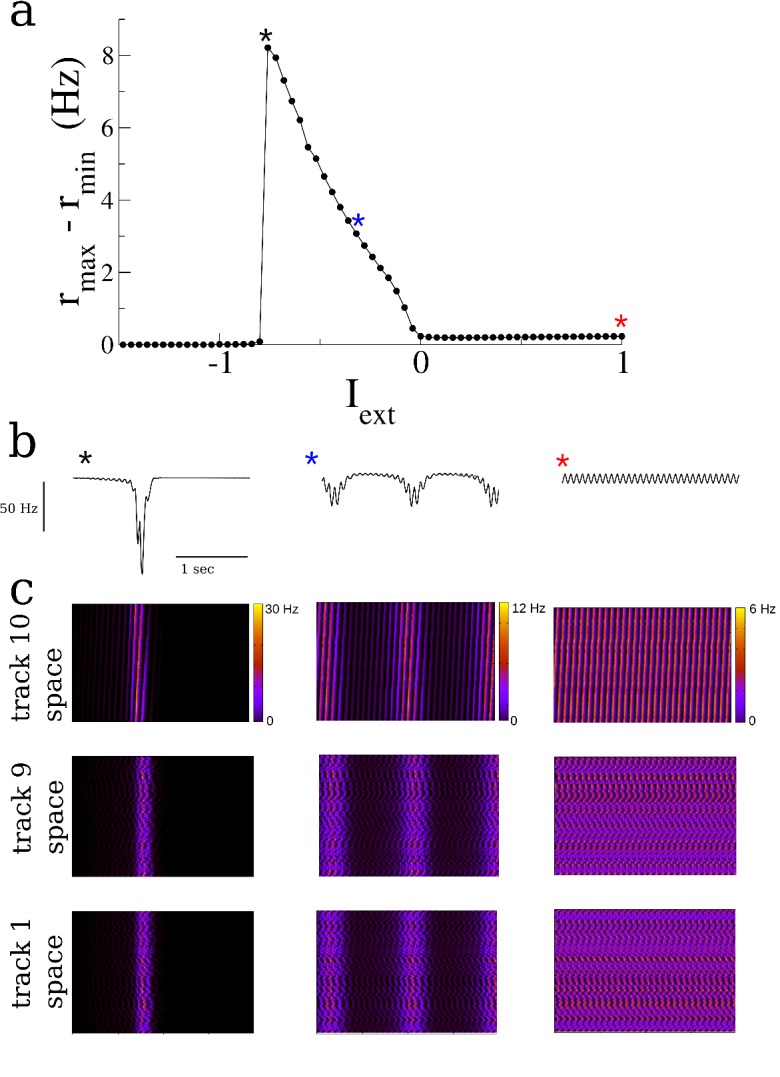
Figure 2—figure supplement 7. The degree of ‘burstiness’ of spontaneous activity can be modulated by a global external input.
