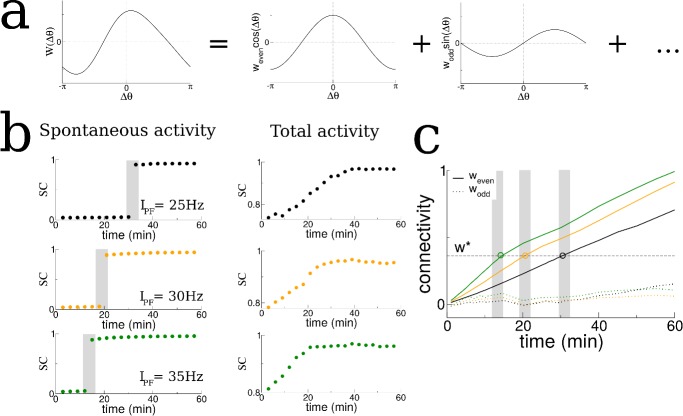
Figure 3. The transition in the structure of burst activity occurs when the even component of the recurrent connectivity reaches a critical value.
This mode grows only for STDP rules with dominant potentiation, and grows fastest when periodic modulation is in the theta range. (a) The profile of the recurrent connectivity at any point in time can be decomposed into a series of even (cosine) and odd (sine) modes. Only the first two modes are shown. (b) As the amplitude of the place-field input is increased from 25 Hz (black), 30 Hz (orange) and 35 Hz (green) the transition shifts to earlier times. The SC of the SWR activity shows a sharp transition (shaded grey bars), while the total activity displays a smooth increase leading up to the transition. (c) In all cases the value of the even mode reaches approximately the same critical value at the time of the transition (shaded grey bars). The growth of the odd mode (dotted lines) is much more irregular, and its value does not correlate with the transition time.

