. 2018 Oct 25;7:e37388. doi: 10.7554/eLife.37388

Figure 7. The SC of place cells in rat hippocampus during the exploration of a novel track shows an initial increase and plateau, but only when theta is present.

(a) Sample firing rate profiles from place cells recorded from CA1 of rat hippocampus during exploration of a novel periodic track with an illustration of how cells can be ordered according to their phases. (b) The SC calculated over the entirety of the experiment (35 min) given the correct ordering (red dot) and for 5000 reshuffled orderings. (c) The time course of SC given the proper ordering (solid symbols) does not show any dynamics when the medial septum is reversibly inactivated with muscimol. Note, however, the clear separation with the shuffled data (open symbols), indicating that place fields are intact even though theta is disrupted. (d) After a rest period the animal is placed back onto the same track; the SC now exhibits a significant increase given the proper ordering (solid symbols) over the first 10 min of exploration and then plateaus. Note that the bottom plots in (c) and (d) show the power spectrum of hippocampal LFP (CA1), indicating a large reduction of theta power in the muscimol condition. (e) When the animal is allowed to explore a novel track and then placed back on the track for a second and third session, there is a significant increase in the SC only during the first session. Error bars are S.E.M.

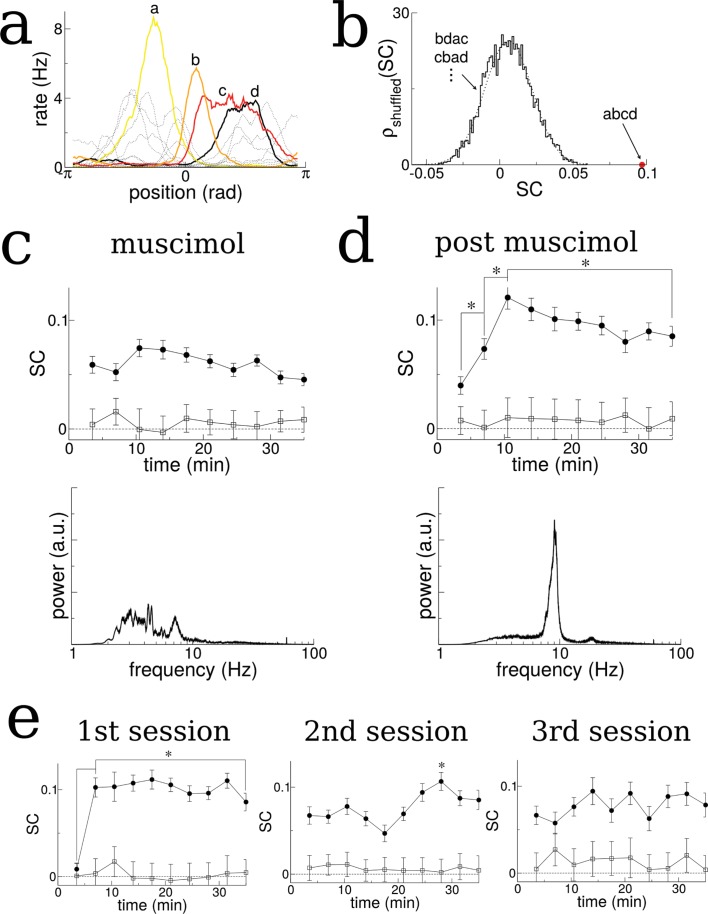
Figure 7.

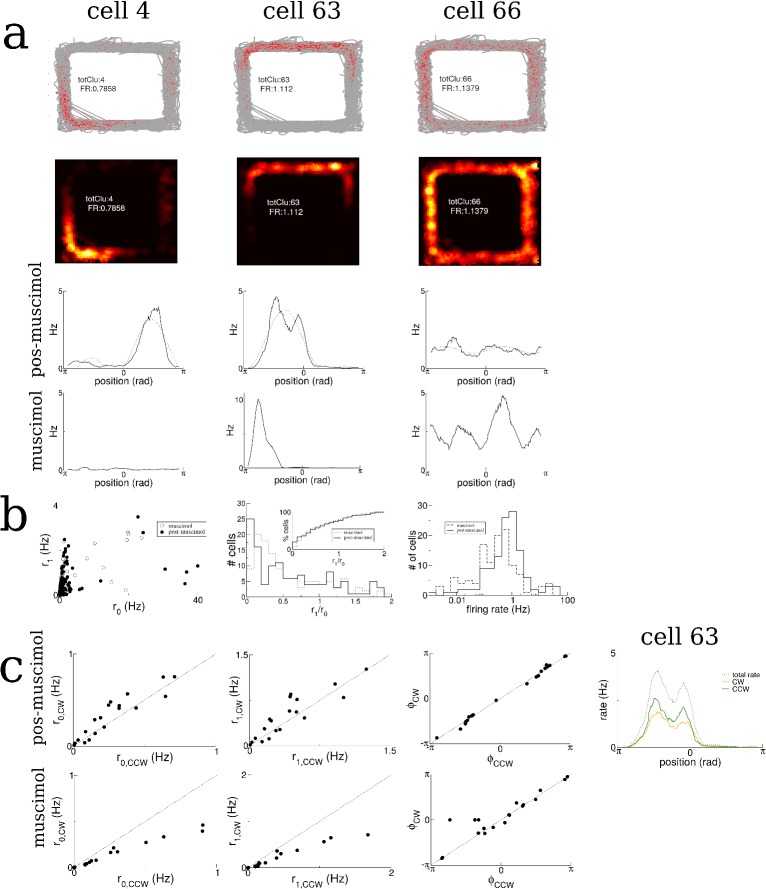
Figure 7—figure supplement 1. Place cell statistics for rat A991.

Figure 7—figure supplement 1.

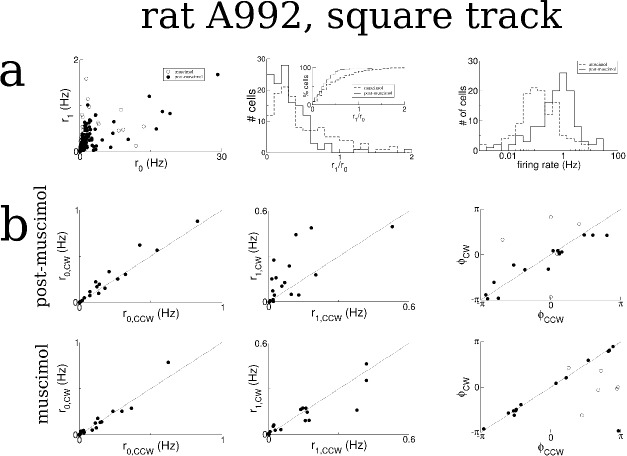
(a) Three sample cells. Spike maps (top), rate maps (middle) and linearized rate along the track with muscimol and post-muscimol (bottom). Each linearized rate profile is fit by a curve r=r0+r1cos(θϕ1)+r2cos2(θϕ2) and the coefficients extracted. (b) Left: The values of the coefficients of the first cosine mode vs. the spatially homogeneous mode for all cells. Middle: The histogram of the tuning index ratio for all cells. Right: Histogram of firing rates. (c) There is only weak rate-remapping for clockwise versus counter-clockwise motion. (Left to right) The first two Fourier coefficients and phase of the fit to the linearized rate profiles in the clockwise versus the counter-clockwise direction, and a sample cell.
Figure 7—figure supplement 2. Same as Figure 7—figure supplement 1 for rat A992.

Figure 7—figure supplement 2.

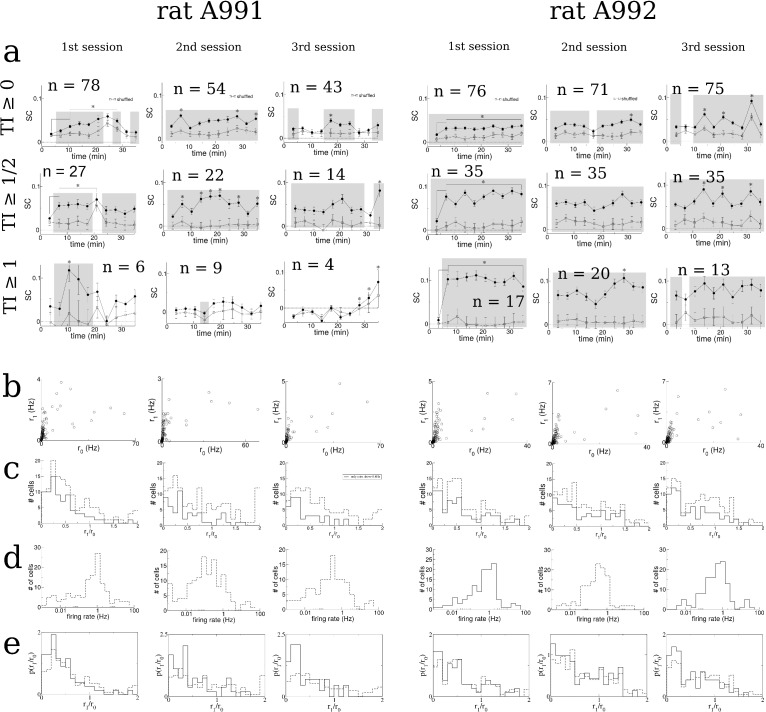
Figure 7—figure supplement 3. Figure 7—figure supplement 3 SC and statistics for cells recorded during three sessions exploring a novel hexagonal track, from two rats.

Figure 7—figure supplement 3.

(a) Time-resolved SC for each session. Asterix and shaded regions as above, in Figure 7—figure supplement 4. (b) First Fourier coefficient plotted versus the zeroth order coefficient of average place field activity for all cells. (c) Histogram of the TI for all cells (dashed line) and for those cells with mean firing rate >0.4 Hz (solid lines). (d) Histogram of firing rates. e. Norrmalized TI histograms.
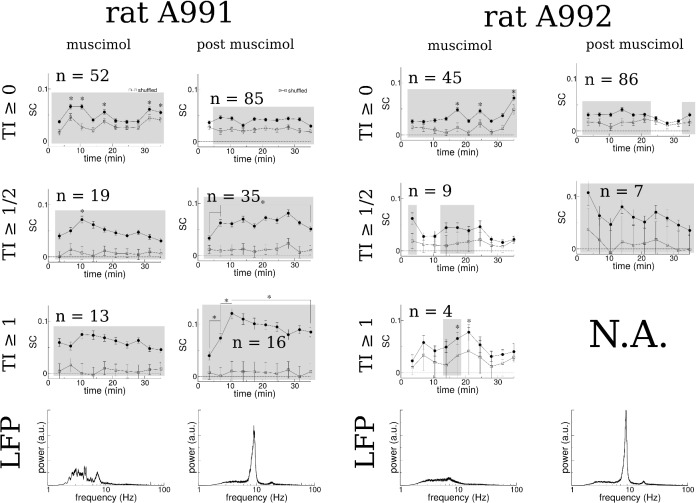
Figure 7—figure supplement 4. The time-resolved SC for both rats both with medial septum inactivation (muscimol) and after recovery (post muscimol) and for different selection criteria of the tuning index (TI) of place fields.

Figure 7—figure supplement 4.

Asterix indicates a significant difference with the first data point (t-test p<0.006 corrected for multiple comparisons) except for the second asterix in the plot of SC for TI1 which indicates a significant difference between the second and third data points. Shaded regions indicate a significant difference between SC and that of 5000 shuffles with randomized ordering (t-test p<0.005, corrected for multiple comparisons). Bottom: Power spectra of LFP recorded during each session.