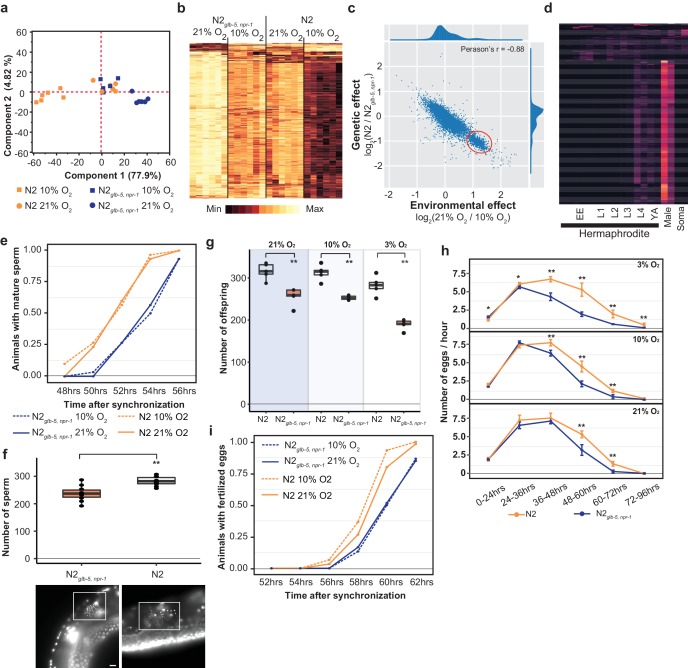
Figure 5. Reproductive timing in N2 occurs earlier than the N2glb-5,npr-1 strain.
(a) PCA analysis of transcriptional profiles of bleach-synchronized N2 and N2glb-5,npr-1 animals grown in 10% or 21% environmental O2 (six replicates per strain/condition). The largest two eigenvectors are shown, along with the amount of variance they explain. Developmental age of animals is approximately L4 stage. (b) Hierarchical clustering of normalized, differentially expressed genes. Columns show strain and conditions; rows show gene expression. (c) Averaged effect of genotype (y-axis) vs environment (x-axis) for each gene (Supplementary file 1). A small cluster of 652 genes with similar changes is circled in red. (d) The developmental expression of these 652 genes was further investigated using a previously published dataset. Columns show developmental stage and rows show each gene. Most of these gene peaked in expression in L4 hermaphrodite animals and was further enriched in male L4 animals (Male). Soma indicates expression levels from somatic cells, suggesting this cluster is enriched in germline cells. (e) Animals identified with mature sperm. x-axis indicates time since synchronization using hatch-off. Strain/condition shown in legend. p=0.0076 by Friedman test. (f) Number of sperm produced by each strain as determined by DAPI straining. Representative images are shown below. Scale bar = 10 μm. **p<0.01 by Wilcoxon-Mann-Whitney nonparametric test. (g) Averaged total number of offspring produced by each strain when grown in different environmental O2 levels. **p<0.01 by Wilcoxon-Mann-Whitney nonparametric test. (h) Averaged egg-laying rate of L4-synchronized N2 and N2glb-5,npr-1 animals when grown at different O2 levels. x-axis indicates time since L4 stage. NS, not significant, *p<0.05, **p<0.01 by Wilcoxon-Mann-Whitney nonparametric test. (i) Number of animals observed with fertilized eggs in their uterus. x-axis indicates time from synchronized egg-lay. p=0.0109 by Friedman test.

