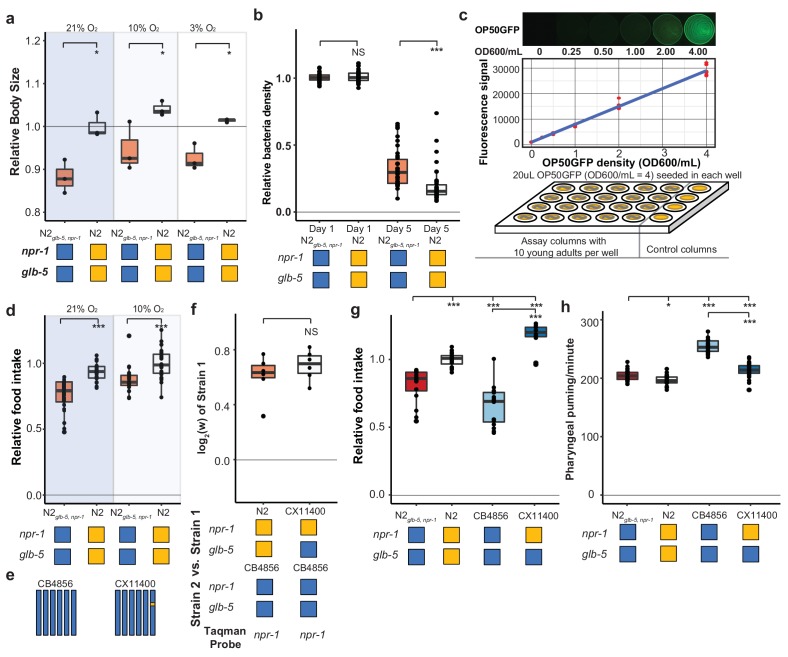
Figure 6. Feeding differences of strains containing derived alleles.
(a) N2 and N2glb-5,npr-1 animals were synchronized by hatch-off and allowed to grow at the indicated O2 levels for 72 hr. Video recordings were used to estimate the size of the animals. *p<0.05 by Wilcoxon-Mann-Whitney nonparametric test. (b) A previously published liquid, bacterial clearing assay was used to estimate food consumption for the N2glb-5,npr-1 and N2 animals. On day 4, N2 animals had consumed more bacteria than N2glb-5,npr-1animals. NS, not significant, ***p<0.001 by Wilcoxon-Mann-Whitney nonparametric test. (c). To test food consumption on agar plates, we developed a new assay by seeding 24-well agar plates with defined amounts of OP50-GFP bacteria. The number of bacteria on the plate could be estimated using a microplate reader. (d) N2 animals consumed more food than N2glb-5,npr-1 regardless of foraging behaviors. ***p<0.001 by Wilcoxon-Mann-Whitney nonparametric test. (e) Schematic of CB4856 wild strain (blue) and a NIL (CX11400) containing the N2 allele of npr-1 from N2 (orange). (f) We tested the fitness effect of the N2 allele of npr-1 in the CB4856 wild strain using the CX11400 NIL strain. NS, not significant by Wilcoxon-Mann-Whitney nonparametric test. (g) Food consumption assays between CB4856 and N2 strains or CB4856 and the CX11400 NIL. ***p<0.001 by ANOVA with Tukey’s Honest Significant Difference test. (h) Pharyngeal pumping rates of N2, CB4856 and two NIL strains. *p<0.05, ***p<0.001 by ANOVA with Tukey’s Honest Significant Difference test.


