. 2018 Oct 17;7:e38137. doi: 10.7554/eLife.38137

Figure 1. A concentration gradient of Bnl:GFP adopts precise morphologies of the recipient ASP.

(A) Drawings depicting budding and directed growth of the third instar larval ASP (red, btl expression) regulated by Bnl produced in a restricted group of cells in the wing disc (green); Bnl source spatiotemporally changes position ahead of the growing ASP; TC, transverse connective. (A’) Drawing depicting hypothetical chemotactic gradient of secreted Bnl (green) that was predicted to guide the directed ASP (red) growth toward the Bnl expressing cells (green circle). (A’’) Drawing depicting a cross-section of the late third instar larval ASP and wing disc, showing their epithelial contours, relative position in X-Z-Y dimension, putative Bnl- responsive cells (red), and disc bnl-expressing cells (green); upper/lower Z. (B) A schematic map of bnl:gfpendo knock-in allele; grey box, non-coding exons; orange box, coding exons; line, introns. (C–D’) Z-projected images showing that Bnl:GFP, produced at physiological level from the bnl:gfpendo allele, moved from the disc bnl-source to the ASP and distributed along the distal to proximal direction of the recipient tissue; (C,C’) bnl-source marked by CherryCAAX expression (bnl-LexA, lexO-CherryCAAX/bnl:gfpendo); (D,D’) recipient ASP marked by CD8:Cherry expression (btl-Gal4,UAS-CD8:Cherry/+; bnl:gfpendo); (C,D) merged red and green channels; (C’,D’) only the green channel; arrows, Bnl:GFP signal detected specifically in the wing disc source and recipient ASP. (E) Graph showing the Bnl:GFP concentration gradient along the ASP D-P axis in late third instar larvae (N = 4 independent samples). (F) Coordination of Bnl:GFP gradient formation with the ASP growth; time points, hours (h) after third instar larval molt; relative position of bnl-source marked by dashed-line. (G) Narrow range of Bnl:GFP gradient in shorter ASPs from early third instar larvae (N = 3 independent samples). (E,G) Red line graph, trend-line of the X-Y scatter plot with exponential fit from the averaged value; Cmax, maximum average Y value (Bnl:GFP intensity); (H) Negative correlation of the ASP D-P axis length and the slope (Cmax to C1/2max) of the Bnl:GFP gradient; each coordinate represents a single disc-ASP tissue; upper panels, Bnl:GFP distribution in three examples of ASPs with different lengths of D-P axis (the cropped region). (I) A 3D sagittal view showing a continuous long-range Bnl:GFP distribution across the entire recipient ASP epithelium adopting its tubular contour; expression of a target gene reporter of Bnl signaling, pntP1-lacZ (red, anti-βGal) showing corresponding signaling response; (I’,I’’) Intensity plots of Bnl:GFP (green) and pntP1-lacZ (red) (I’’) across the entire ASP epithelium derived from the digitally straightening ASP epithelium shown in I’. (J) Drawing of a cross section of the ASP-wing disc, summarizing the observations from C,D,I. (C–I’) Fixed samples, Z-projection, except I-I’; AU, arbitrary unit; dashed line, ASP or wing disc outline. Scale bars, 30 μm.

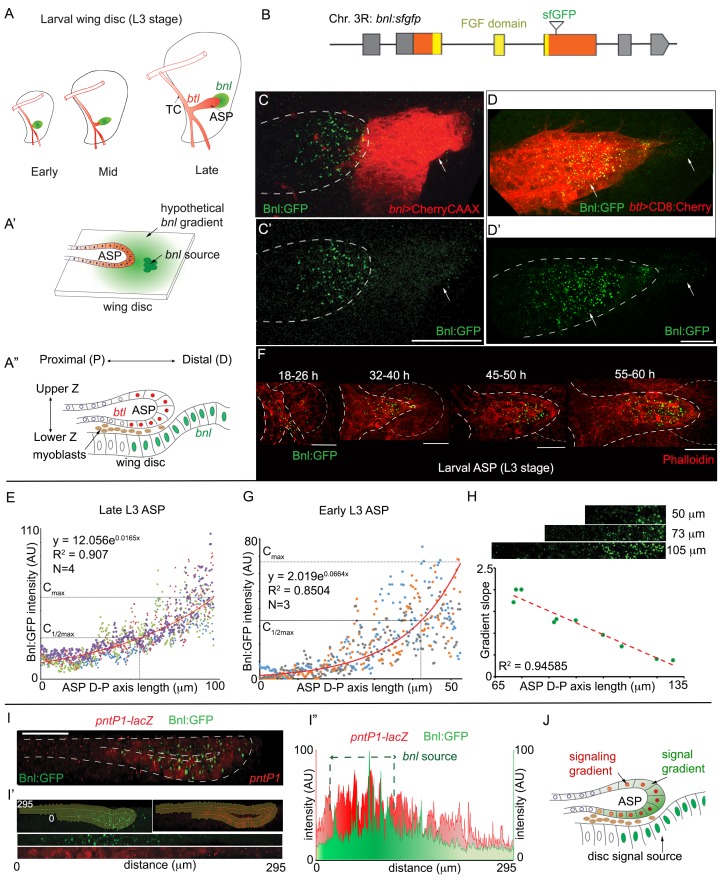
Figure 1—source data 1. Data for the intensity profile plot of Bnl:GFP along the D-P axis of the late 3rd instar larval ASP in Figure 1E.
DOI: 10.7554/eLife.38137.006
Figure 1—source data 2. Data for the intensity profile plot of Bnl:GFP along the D-P axis of the early 3rd instar larval ASP in Figure 1G.
DOI: 10.7554/eLife.38137.007
Figure 1—source data 3. Numerical data for correlation of the length of the D-P axis of the ASP and the slope of the Bnl:GFP gradient in Figure 1H.
DOI: 10.7554/eLife.38137.008
Figure 1—source data 4. Data for the intensity profile plots of Bnl:GFP and pntP1-lacZ along the digitally straightened tubular ASP epithelium in Figure 1I”, Figure 1—figure supplement 2D”, and Figure 1—figure supplement 2E”.
elife-38137-fig1-data4.xlsx (293.4KB, xlsx)
DOI: 10.7554/eLife.38137.009

Figure 1.

Figure 1—figure supplement 1. Generating genome-edited flies harboring a bnl:gfpendo allele.

Figure 1—figure supplement 1.

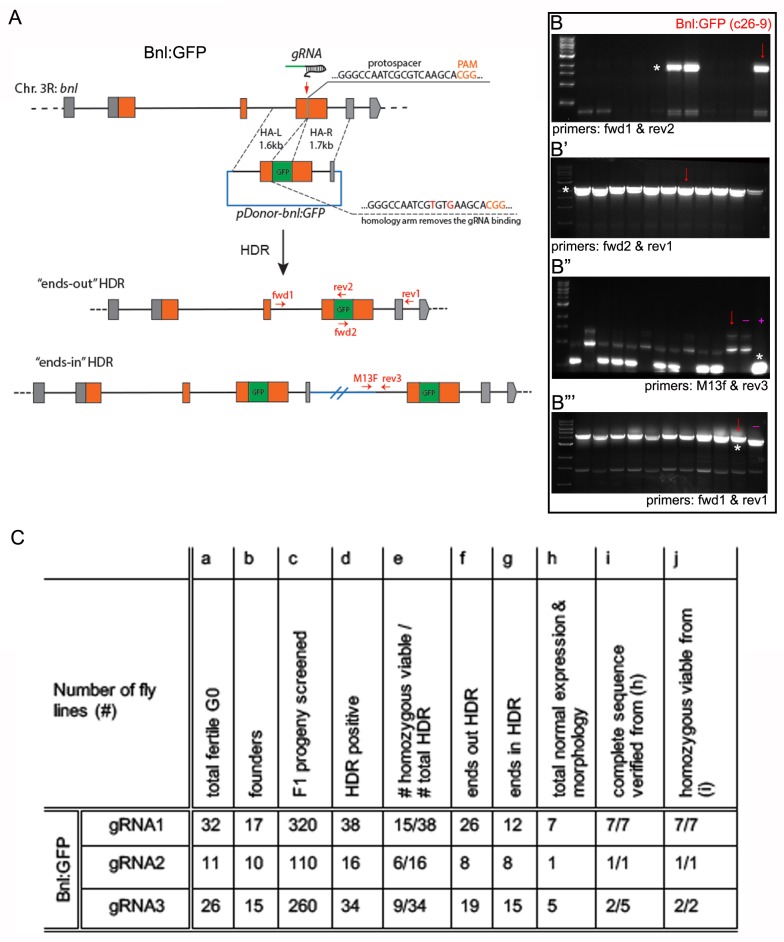
(A) Scheme for CRISPR/Cas9-based generation of bnl:gfpendo and two possible outcomes from the HDR; orange box, coding exon; grey box, non-coding exon; line, introns; red vertical arrow, approximate gRNA target site; horizontal red arrows, approximate primer binding sites. (B-B’’’) Representative agarose gel pictures showing examples of the three-step PCR-based CRISPR screening process; red arrows, amplicons from gDNA of the c26-9 line used in this study; (B) PCR amplification products (*) obtained from the gDNA of different lines using primers fwd1-rev2 identified the gfp sequence containing positive HDR lines; (B’) HDR positive lines identified in B (e.g., c26-9), were reconfirmed by PCR using fwd2-rev1 primers; (B’’) the HDR positive lines identified in B,B’, were subjected to PCR screening using primers M13F and rev3; the lower-most bands (*) indicated unintended ‘ends-in’ HDR; Absence of the band showed probable ends-out HDR; (B’’’) the putative ‘ends-out’ HDR were confirmed with PCR amplification of the correct sized product with fwd1-rev1 primers, both of which annealed to the flanking gDNA regions outside of the inserted cassette; the correct ends-out HDR amplified ~700 bp longer product due to the presence of gfp sequence than the negative control untagged parental gDNA; markers, 1 kb DNA ladder from NEB; (B’’,B’’’) (-) represents PCR product amplification from negative control: gDNA from the nos-Cas9 parental line; (+) represents PCR product amplification from positive control: pDonor-bnl:GFP plasmid. (C) A table showing efficiency of generating bnl:gfpendo lines using CRISPR/Cas9; numbers of HDR progenies in (d,f,g) were determined by PCR based screen similar to B-B’’’; gene expression in (h) was verified in the larval imaginal discs, trachea, brain and embryo; normal morphology in (h) was verified in embryonic and larval trachea, and overall tissue morphology.

Figure 1—figure supplement 2. Characterization of Bnl:GFP distribution in the ASP.

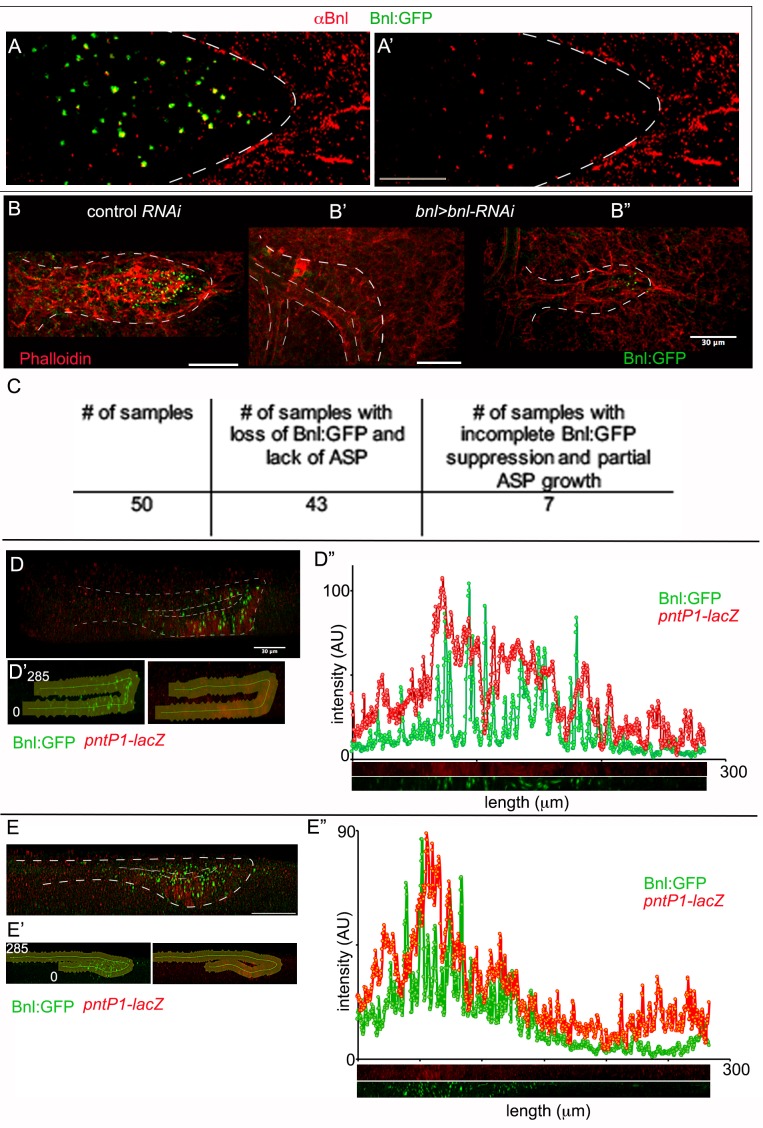
Figure 1—figure supplement 2.

(A, A’) Immunostaining with αBnl antibody (red) recognized Bnl:GFP puncta in the ASP; (A) merged channels; (A’) only the red channel. (B-C) Effect on the ASP (outlined by white dashed line) growth by knocking-down of bnl:gfpendo expression with bnlRNAi (bnl-Gal4/UAS-bnlRNAi,bnl:gfpendo); (B) control (bnl-Gal4/bnl:gfpendo); (B’,B’’bnl-RNAi (bnl-Gal4/UAS-bnlRNAi,bnl:gfpendo); (B’) complete knock down and growth suppression; (B’’) partial knock down and growth suppression; red, phalloidin; (C) a table showing phenotypic consequences of bnlRNAi-mediated knock down of bnl:grpendo. (D-E’’) 3D sagittal views showing long-range Bnl:GFP distribution adopting the ASP tubular morphology; expression of a target gene reporter of Bnl signaling, pntP1-lacZ (red, anti-βGal) showing corresponding signaling response; (D’,E’) outline of the ASP epithelium selected for the digital straightening; (D’’,E’’) intensity plots from the digitally straightened (lower panels) epithelium from (D’ and E’) respectively. (A-B’,D,E) white dashed lines, ASP outlines. Scale bars, 30 μm.