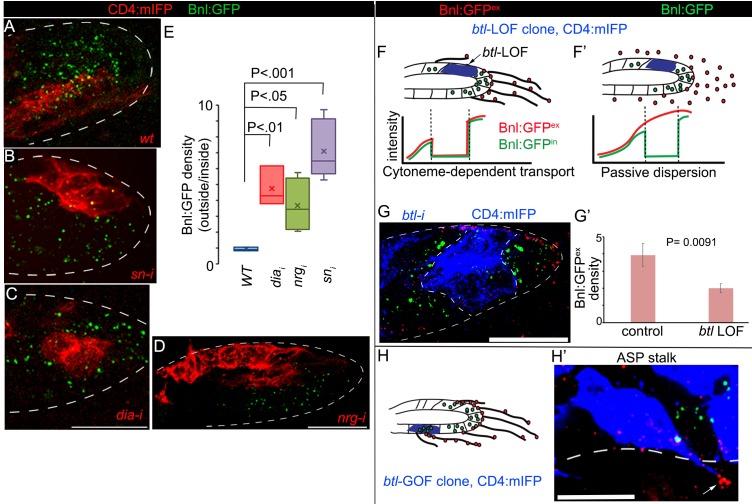
Figure 4. Cytonemes are essential for tissue-specific Bnl:GFP gradient profile.
(A-D) Representative images of Bnl:GFP uptake in CD4:mIFP-marked (red) clones in the ASP: (A) wt; (B) snRNAi, (C) diaRNAi; (D) nrgRNAi. (E) A box plot comparing the ratios of Bnl:GFP concentration outside (unmarked WT area) to inside (marked mutant area) of the CD4:mIFP-marked cytoneme-deficient mutant clones, expressing either diaRNAi (N = 3), nrgRNAi (N = 4), or snRNAi (N = 6) with that of the control marked WT clones (N = 3); P values, two-tailed t-test. (F,F’) Schematic models predicting differences expected in distribution patterns of EIF-stained Bnl:GFPex (red) on btl LOF clones (blue) either in diffusion-based (F’) or cytoneme-dependent (F) Bnl:GFP transport mechanism. Intracellular Bnl:GFP (green, Bnl:GFPin) level is expected to be reduced in both modes of signal transport. (G) Representative image showing autonomous loss of distribution of Bnl:GFPex (red, αGFP EIF-stained) in CD4:mIFP-marked (blue) btl LOF (btlRNAi) clone. (G’) Plot comparing relative Bnl:GFPex (red) density inside (mutant area) versus outside (WT area, control) of btl LOF clones (N = 3 independent ASPs); P values, two-tailed t-test. (H,H’) Representative image showing enrichment of αGFP EIF stained Bnl:GFPex (red) on long cytonemes (arrow) projected from btlGOF clones in the ASP stalk. Genotypes: hs-FLP/+; btl>y+>Gal4/+; UAS-CD4:mIFP, bnl:gfpendo/+ (A) or UAS-‘x’-RNAi (B–G) or UAS-btl (H’). Scale bars, 30 μm.
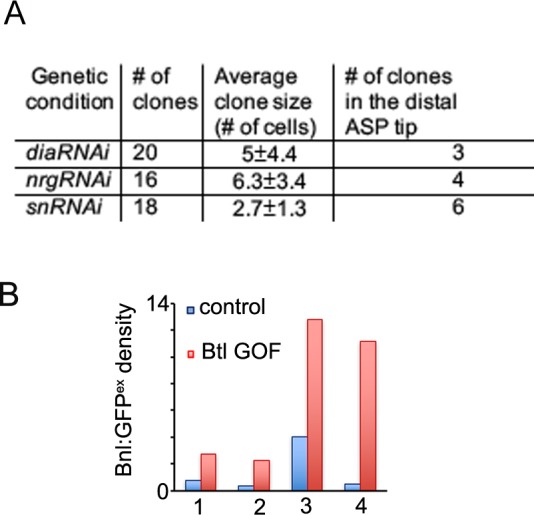
Figure 4—figure supplement 1. Cytonemes are essential for Bnl:GFP gradient.


