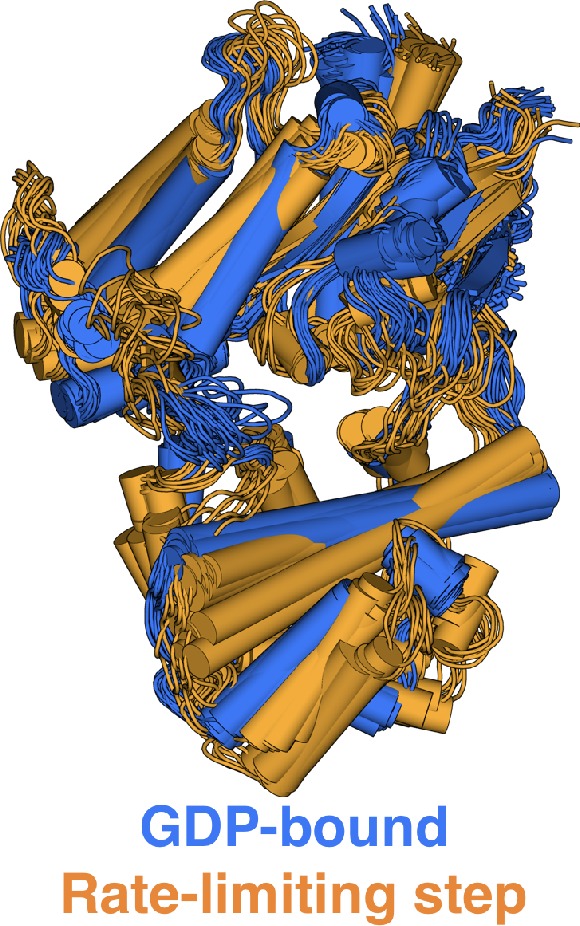
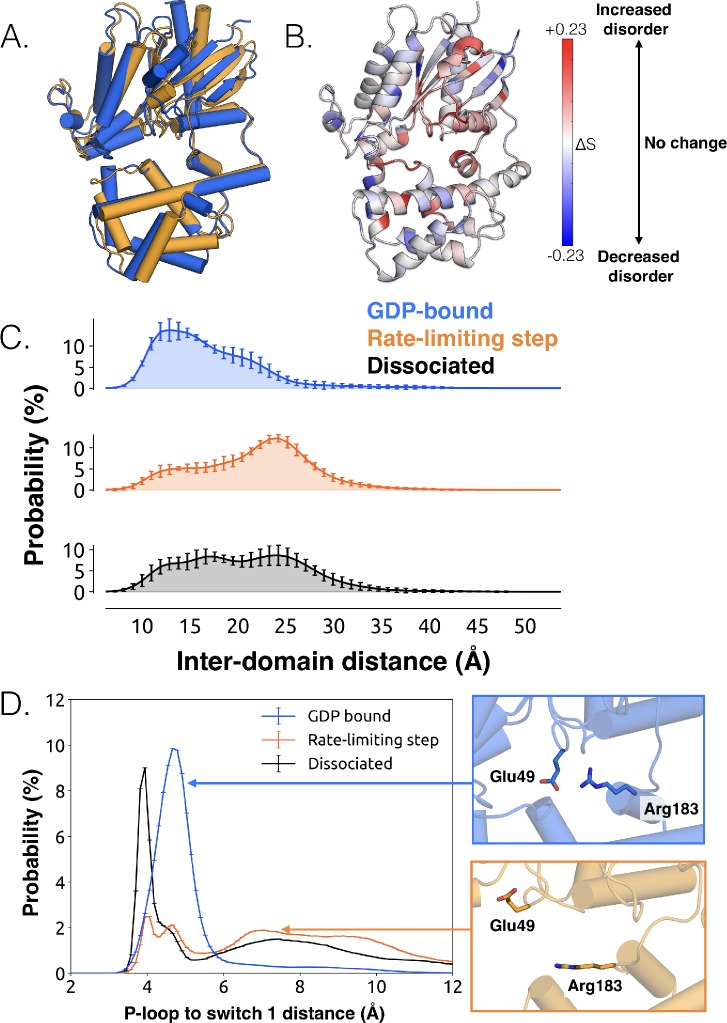
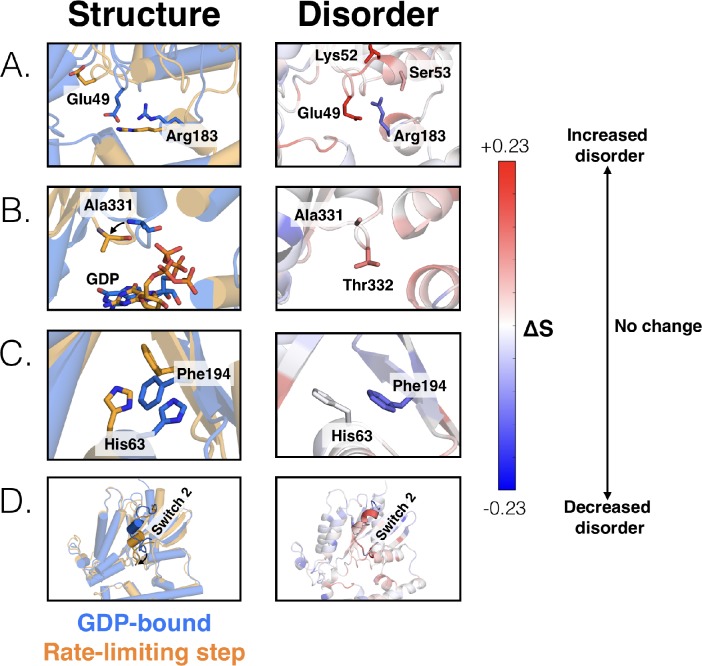
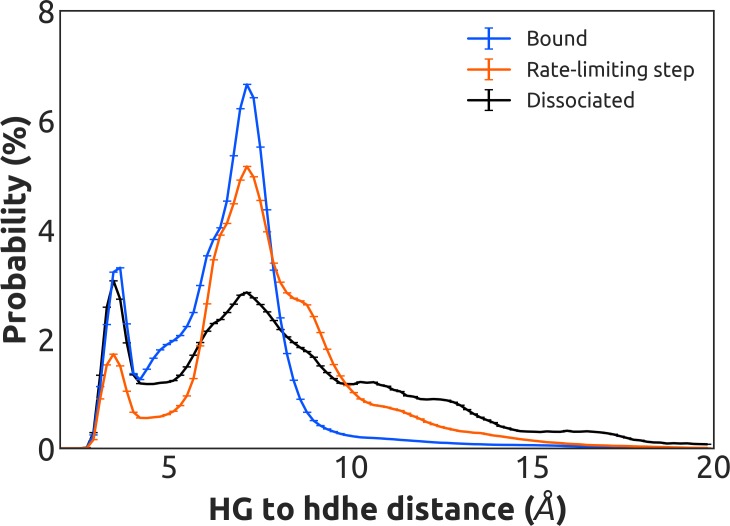
Figure 2. Structural and dynamical changes during the rate limiting step for GDP release.
(A) Overlay of representative structures before (blue) and after (orange) the rate limiting step. (B) Change in conformational disorder (Shannon entropy) across the rate-limiting step, according to the color scale on the right. (C) Histograms of inter-domain distances before (top, blue) and after (middle, orange) the rate limiting step, along with the inter-domain distance distribution after GDP is released (bottom, black). Inter-domain distance is measured using residues analogous to those used in DEER experiments (Dror et al., 2015), Leu97H.HA.29 in the helical domain and Glu250G.H3.4 on H3. (D) Distribution of distances between Glu49G.s1h1.4 and Arg183G.hfs2.2 (left) before (blue) and after (orange) the rate-limiting step, as well as after GDP release (black). Representative structures of the interacting residues are also shown (right).
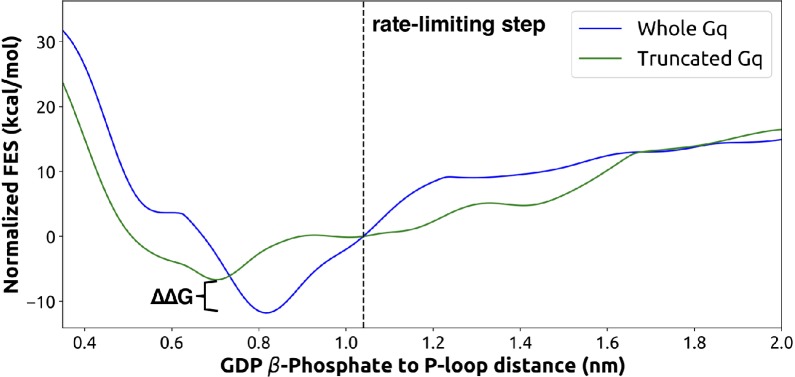
Figure 2—figure supplement 1. Free-energy surface from metadynamics simulations of GDP release for the full Gαq (blue) and truncated form (green, without the last five C-terminal residues).
Figure 2—figure supplement 2. Overlay of representative structures of Gαq when bound to GDP (blue) or across the rate-limiting step (orange).
