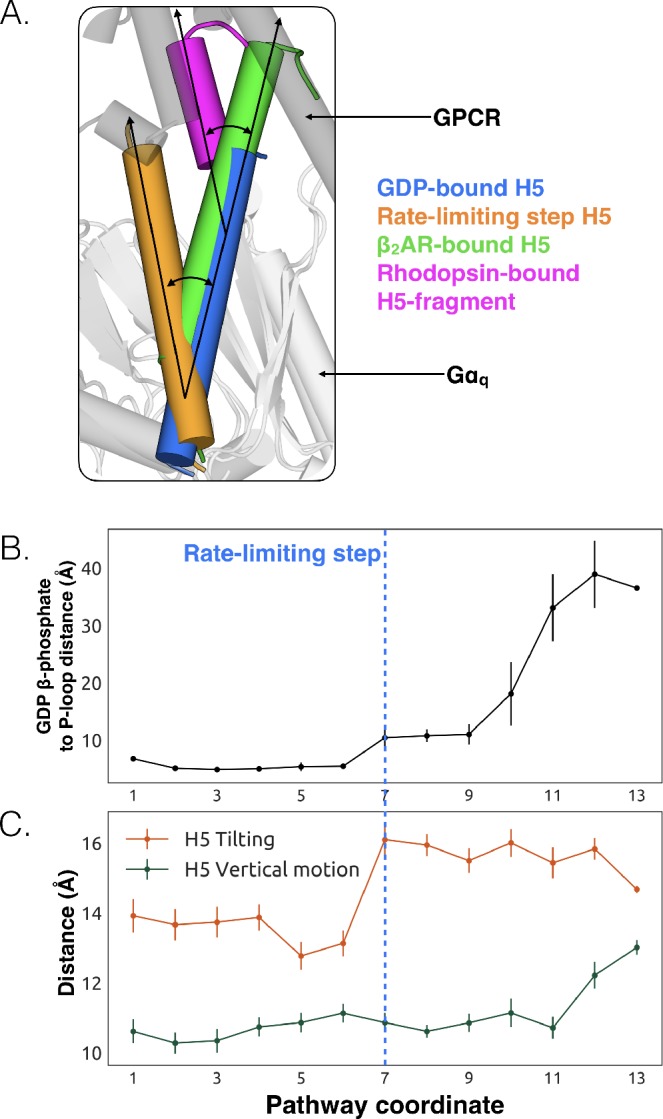
Figure 3. Tilting of H5 is correlated with GDP release but translation of H5 is not.
(A) Displacements of H5 relative to the GDP-bound crystal structure (blue). The three other orientations of H5 come from the rate-limiting step in our model (orange), the co-crystal structure of Gαs and β2AR (green, PDB ID 3SN6) (Hilger et al., 2018), and the co-crystal structure of a C-terminal fragment of Gαt and rhodopsin (magenta, PDB ID 3PQR) (Van Raamsdonk et al., 2010). The black arrows highlight the change in orientation of the long axis of each helix. A representative GPCR (gray) and Gα (white) structure are shown for reference. (B) GDP release distance across the highest flux pathway, defined as the distance from the GDP β-phosphate to the center of mass between residues Lys52G.H1.1, Ser53G.H1.2, and Thr54G.H1.3 on H1. The state marking the rate-limiting step is highlighted by the blue dashed line. (C) H5 motion across the highest flux pathway. The distances measured here representing H5 motion are taken from the same states as in B. H5 tilting (orange) is measured by the distance between Leu349G.H5.16 and Tyr325G.S6.2. Likewise, H5 vertical motion (green) is measured by the distance between Thr334G.H5.1 and Phe341G.H5.8. The rate-limiting step is marked with the blue dashed line, extended down from B.

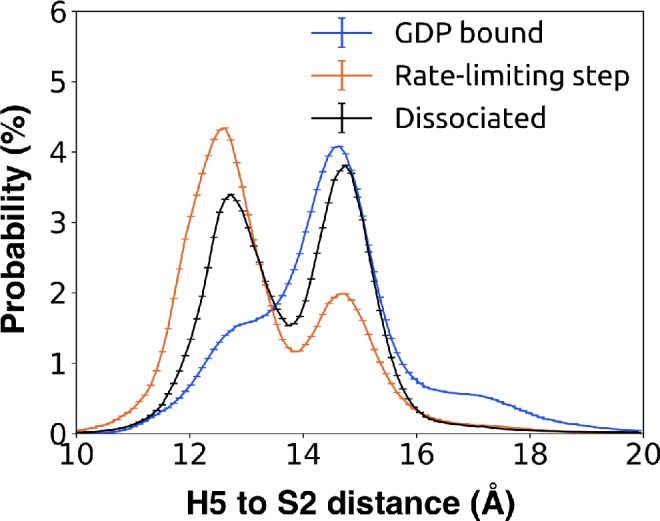
Figure 3—figure supplement 1. Probability distribution of the distance between Leu349G.H5.16 on H5 and Phe194G.S2.6 on S2 to monitor the tilting motion of H5 upon GDP release when bound to GDP (blue), across the rate-limiting step (orange), and upon GDP dissociation (black).

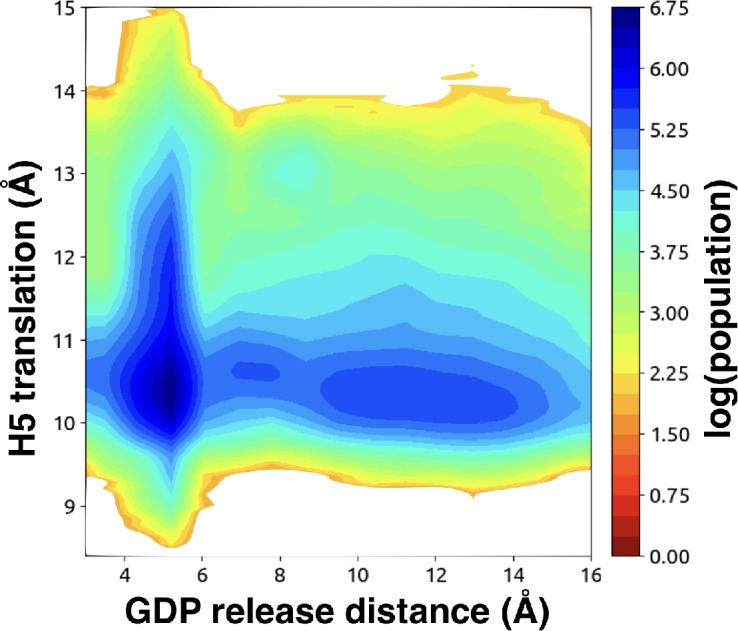
Figure 3—figure supplement 2. H5 vertical motion is sampled across GDP release simulations.

