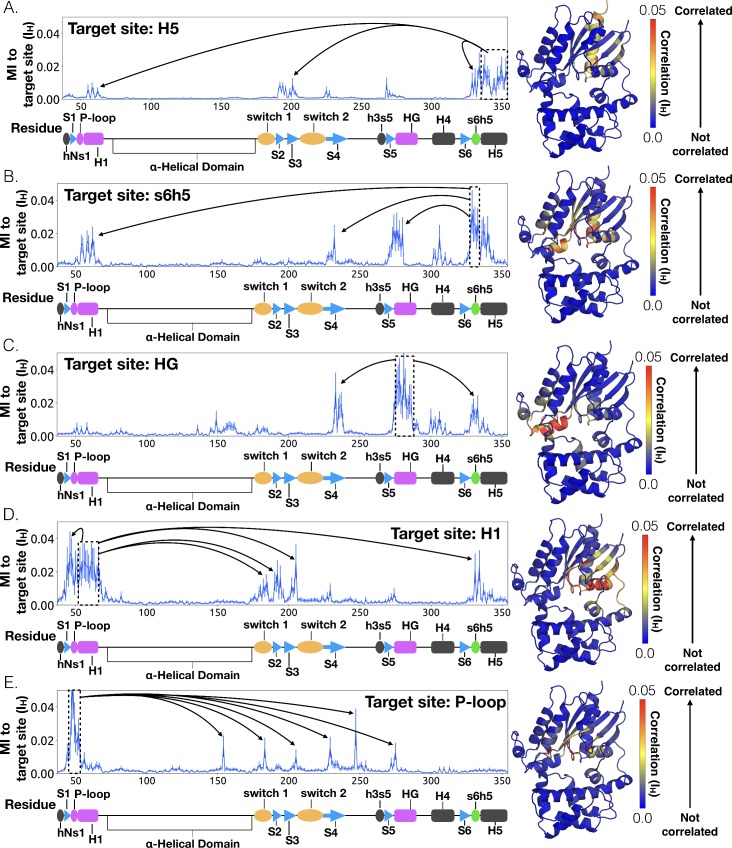
Figure 4. Allosteric network connecting H5 motion to the nucleotide binding-site via s6h5.
CARDS data showing communication per residue to a target site (dashed box) is plotted (left) and mapped onto the structure of Gαq (right) for (A) H5, (B) s6h5, (C) HG, (D) H1, and (E) the P-loop. Arrows indicate regions of importance with significant communication to the target site.

