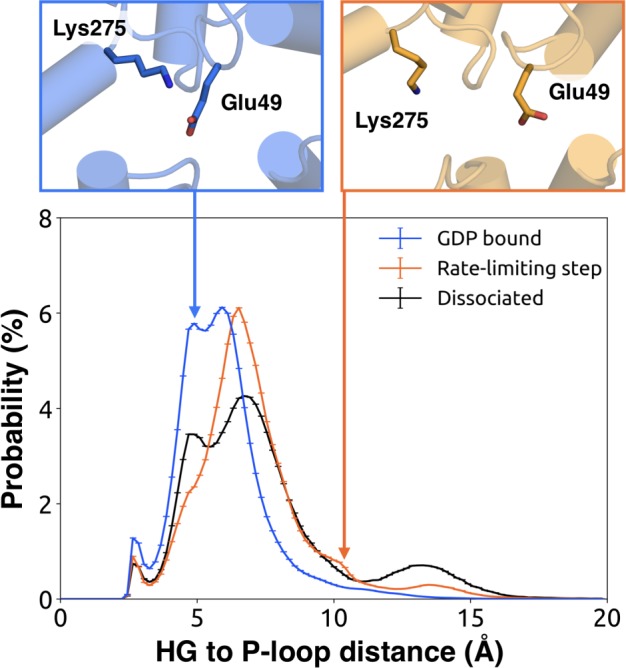
Figure 6. Probability distributions of the distance between the side-chains of Lys275G.s5hg.1 and Glu49G.s1h1.4.

Distributions were computed for the bound (blue), rate-limiting step (orange), and dissociated (black) states. Representative structures (above) for the bound (left, blue) and rate-limiting step (right, orange) are included with residues as sticks.
