Fig. 1.

Expression and distribution of miR-140-3p in arterial walls
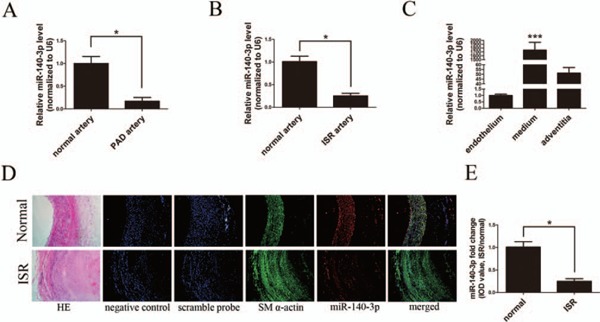
A and B, Relative expressions of miR-140-3p in normal (n = 6), PAD (n = 10), and ISR (n = 10) arterial walls determined by qRT-PCR. C, Relative expressions of miR-140-3p in endothelium, media, and adventitia of normal arterial walls determined by qRT-PCR. D, Representative graphs of SM α-actin (green) and miR-140-3p (red) co-staining in human normal and ISR sections (scale bars = 100 µm). Hematoxylin–eosin (HE) staining revealed artery structures. Negative control (no SM α-actin antibody and no miRNA probe) and Scrambled probe control (without SM α-actin antibody, but with scrambled miRNA probe) were used to verify no specific staining. Green and red immunofluorescence assays identify the smooth muscle marker SM α-actin and miR-140-3p, respectively. Merged images showed the co-localization of SM α-actin and miR-140-3p. Blue illustrates the cell nuclear staining by DAPI. E, Comparison of the IOD values of miR-140-3p staining in normal and ISR sections; mean miR-140-3p expression levels in normal arteries were defined as 1.0. (n = 10), *P < 0.05, ***P < 0.0001.
