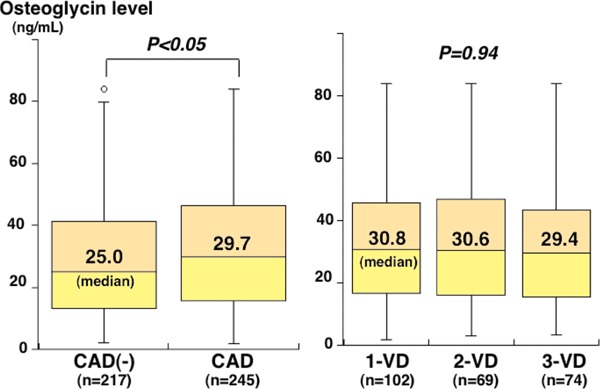
Fig. 1.

Plasma osteoglycin levels and the presence and severity of CAD
Plasma osteoglycin levels were higher in patients with CAD than in those without CAD (P < 0.05), but there was no marked difference in osteoglycin levels among the 1-VD, 2-VD, and 3-VD groups (P = 0.94). The central line represents the median, and the box represents the 25th to 75th percentiles. The whiskers represent the lowest and highest value in the 25th percentile minus 1.5 interquartile range (IQR) and 75th percentile plus 1.5 IQR, respectively.
