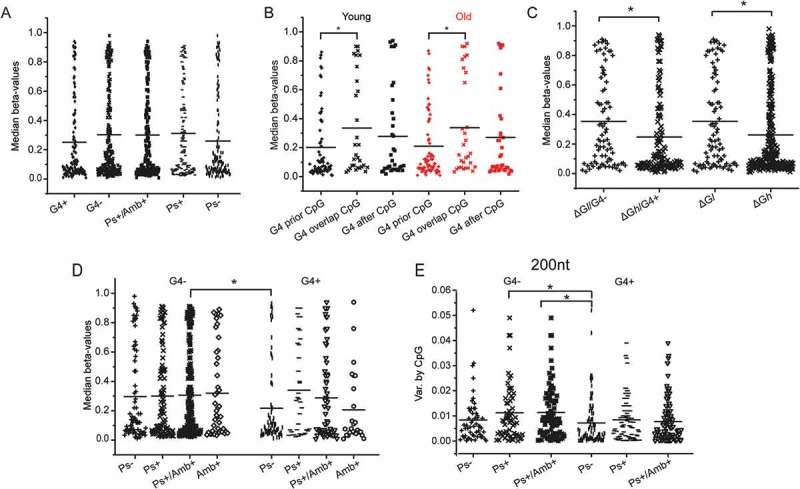
Figure 3.

Dot plots indicating the median CpG methylation and methylation variance by CpG in: A. Young individuals with respect to the propensity of the surrounding sequence (CpG ± 50 nt) to form G4s (G4+) and pseudoknots (Ps), or ambivalent sequences (Amb+), B. Young (black) and old (red) individuals with respect to the relative the positions of CpG and G4s in the surrounding sequence (CpG ± 50 nt), C. Young individuals with respect to the relative folding stability and propensity of the surrounding sequence (± 50 nt) to form G4s (ΔGl < 16.35 kcal/mol, ΔGh > 16.35 kcal/mol), D. Young individuals with respect to the combined presence of G4 and pseudoknots in the surrounding sequence (CpG ± 50 nt). E. Variance of methylation by CpG relative to the sequence propensity to form G4s, identified in different sequence lengths (± 50 nt and ± 100 nt). Statistically significant differences by Student’s t-test are shown by *.
