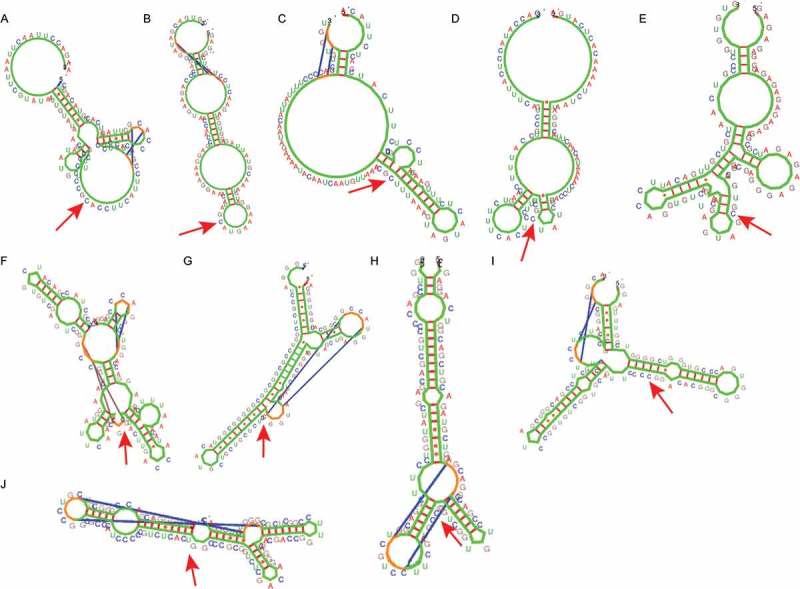
Figure 4.

Characteristic Kinefold structures of ± 50 nt next to the methylation site. Structures (A-E). ΔGl, open-sea sequences, G4-; A, C, D: methylation decrease by aging; B, E: methylation increase by aging. Structures (F-J). G4+, Ps- (according to Hotknots), ΔGh (> 18.14), methylation decrease by aging. The arrows indicate the epigenetic clock CpGs.
