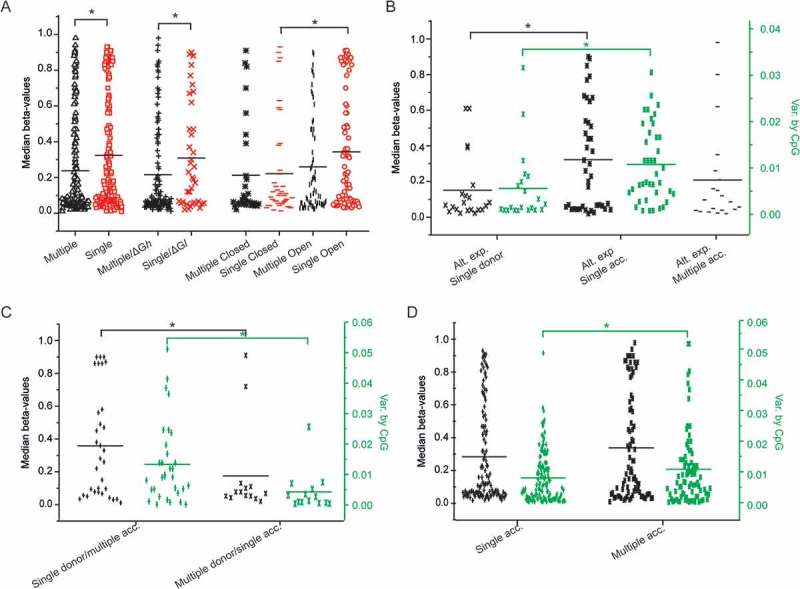
Figure 5.

Dot plots of median methylation and methylation variance by CpG among young individuals relative to the sequence expression, the energy of the transcript, its conformational characteristics and the presence of tentative splice sites. A. Dot plots of CpG methylation in sequences predicted to be alternatively (black) or singly (red) expressed in relation to their propensity to form G4s and Pseudoknots (G4-/Ps+: open conformation, G4+/Ps-: closed conformation) and the relative folding stability (ΔGl, ΔGh) of the corresponding transcript. B. Dot plots of median CpG methylation (black) and methylation variance by CpG (green) in sequences containing single tentative donors (no acceptors) and single or multiple acceptors (no donors), C. Dot plots of median CpG methylation (black) and methylation variance by CpG (green) in sequences containing different combinations of tentative splice sites. D. Dot plots of median CpG methylation (black) and methylation variance by CpG (green) in sequences containing single acceptors and multiple acceptors regardless of the presence of donors. Statistically significant differences by Student’s t-test are shown by *.
