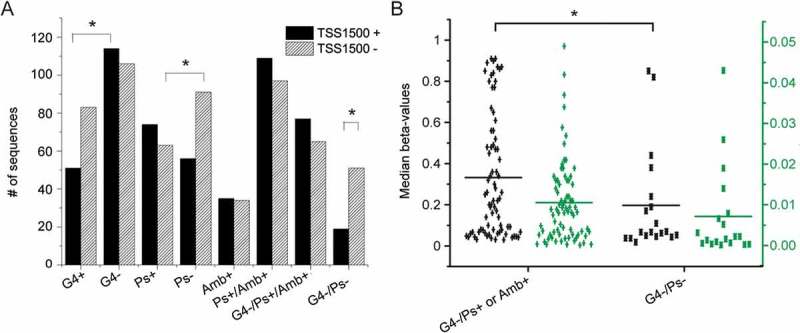
Figure 7.

Characteristics of the 1500 nt regions upstream transcription start sites (TSS1500). A. Frequency of G4, Pseudoknots, ambivalent motifs and their combinations (P values obtained by chi-squared test) in sequences predicted (black) or not (striped) to be loci of transcription initiation. B. Dot plots of median methylation (black) and methylation variance by CpG (green) among young individuals in TSS sequences with ‘open’ or ‘closed’ conformation. Statistically significant differences by Student’s t-test are shown by *.
