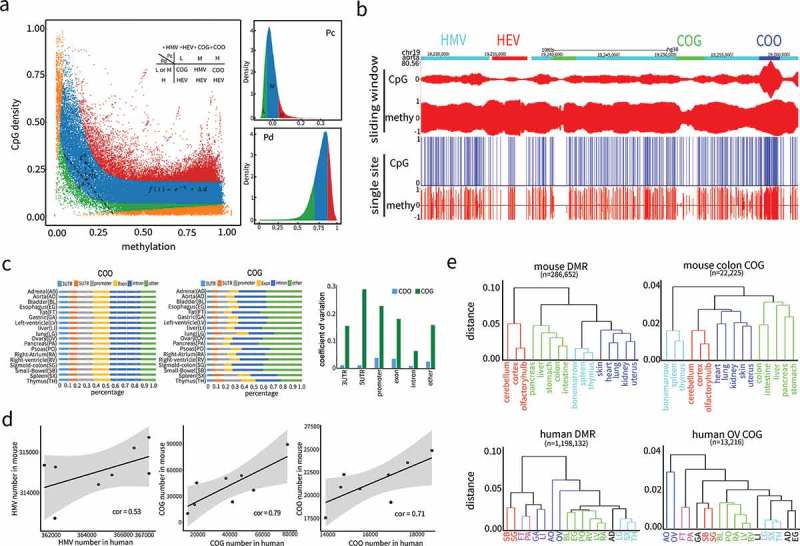
Figure 3.

Nonlinear modelling and algorithm development based on complementarity between CpG density and DNA methylation. (a) Genome partition algorithm (see methods) by modelling the relationship between CpG density and DNA methylation with nonlinear function. Complementary coefficient and differential coefficient were divided into three categories high (H, > 70% quantile, > 70% quantile), medium (M, 20% quantile< < 70% quantile, 20% quantile< < 70% quantile) and low (L, < 20% quantile, < 20% quantile) according to their distributions. Combining and, genome was partitioned into four types of regions: Conflict of Gap (COG) regions, Conflict of Overlap (COO) regions, Harmony with Medium Value (HMV) regions, and Harmony with Extreme Value (HEV) regions. (b) Partitioned regions snapshot from UCSC genome browser. Both single site and sliding window representations are presented. In single site view, CpG sites are marked out by blue bars, methylation is the fraction of methylated reads in total covered reads for each CpG site on Crick (above baseline) and Watson (below baseline) strands. In sliding window view, CpG and methylation refer to CpG density and average methylation in each window on both strands. The four region types, COG (green), COO (blue), HMV (cyan), and HEV (red) are labelled at the top. (c) The proportions in 18 human tissues of COO and COG that coincided with various genome feature regions (3’UTR, 5’UTR, promoter, exon, intron). Coefficient of variations were calculated as the ratio of standard deviation to mean in 18 tissues. (d) Positive correlations of the amount of HMV, COG and COO regions in the eight tissues shared by human and mouse. (e) Unsupervised hierarchical clustering analysis of human and mouse tissues based on DNA methylation level in COG and DMR regions. Tissues were colored to reflect the similarities of their normal functional or developmental origins. Human and mouse DMRs were from the studies[6,34].
