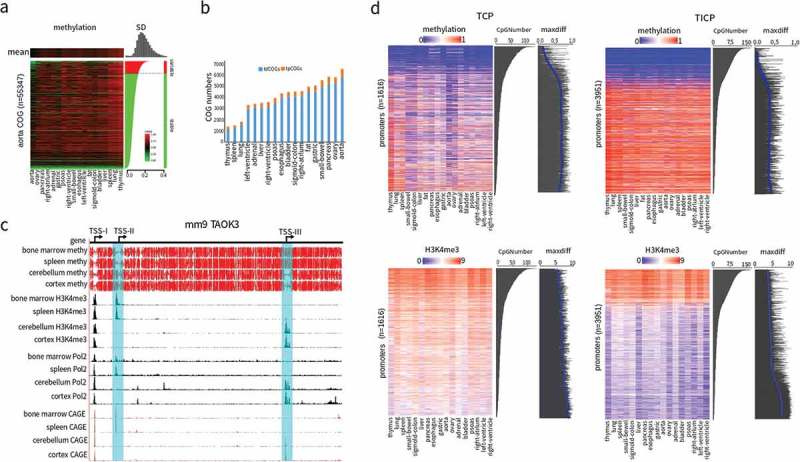
Figure 4.

Selective promoter usage determined by tpCOGs. (a) Heatmap of DNA methylation in COGs of human aorta. The heatmap was vertically ranked by standard deviation (SD) across 18 tissues and horizontally clustered by Euclidean distance. Shown on the top is methylation mean of each tissue, on the right is SD of variable (red, SD > 0.15) and stable (green, SD < 0.15) COGs, on the top right corner is the histogram of SD. (b) The amount of tpCOGs and tdCOGs in all human tissues. (c) Snapshot of the mouse TAOK3 gene in UCSC genome browser. H3K4me3 and PolII data were generated by ChIP-seq [34]. Cap analysis gene expression (CAGE) data were obtained from the FANTOM research projects [45]. TSS-I, TSS-II, and TSS-III denote the 1st, 2nd, and 3rd transcription start site. TSS-II and TSS-III (light blue colored) were identified as TCPs in bone marrow and spleen, or cerebellum and cortex, respectively. See S23 Fig for more thorough data. (d) Heat map of DNA methylation and the corresponding H3K4me3 in tpCOG-coincident promoters (TCPs) and tpCOG-incoincident promoters (TICPs). The heatmap was vertically ranked by CpG number in promoter regions (500 bp up- and down-stream of transcription start site). Maxdiff denotes the maximum difference of methylation among 18 human tissues. The smooth blue lines are the trend lines fitted by LOESS method. H3K4me3 signal refers to the number of ChIP-seq reads falling in promoter regions.
