Figure 6.

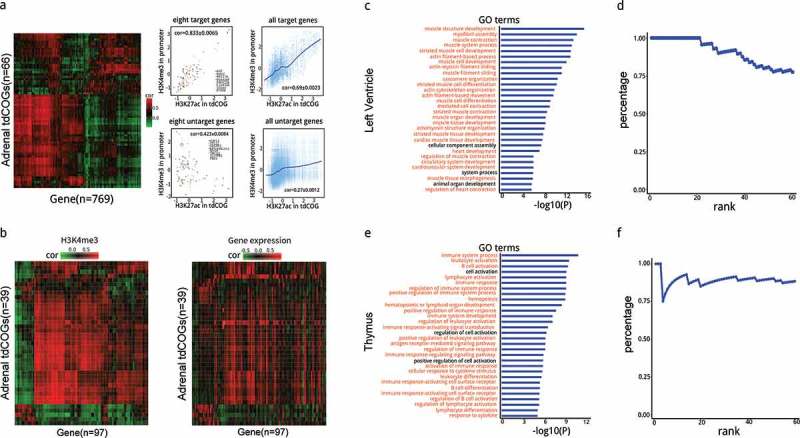
Prediction and analysis of tdCOG targeted genes. (a) Heatmap of the correlation coefficient between human adrenal-derived tdCOGs and their target genes. Correlation coefficients were calculated using H3K27ac signals in each tdCOG and H3K4me3 signals in each promoter across 18 human tissues. Genes with high correlation (> 0.6, shown in red in the heatmap) were considered as the targets of tdCOGs, and with low correlation (shown as green) were considered as non-targets. Signal intensities of histone modifications are shown in scatter plots for the 8 typical target and untargeted genes, or for all the target and untargeted genes. Cor denotes the mean ± SD of correlation coefficients of the eight genes or all the genes. Only tdCOGs on chromosome 1 are shown. (b) Comparison of histone-derived correlation and transcription-derived correlation. Heatmaps were generated as in (a). tdCOGs were also from human adrenal tissue and confined to chromosome 1. Only genes with detectable expression levels were considered, which led to less genes than (a). Histone modification heatmap (left) was clustered, and gene expression heatmap (right) is shown in the same order. (c and e) Functional annotation of target genes in left ventricle and thymus. Gene ontology (GO) terms associated with target genes were retrieved from DAVID database. The terms were ranked by P values (Fisher Exact test). Terms marked in red denote direct functional association with the corresponding tissue. The top 30th terms are shown. (d and f) Percentage of the GO terms directly associated with the corresponding tissues in the top 60 terms. Percentages refer to the fractions of directly associated terms, i.e., red colored terms in (c or e), in total terms at each rank.
