Figure 2.

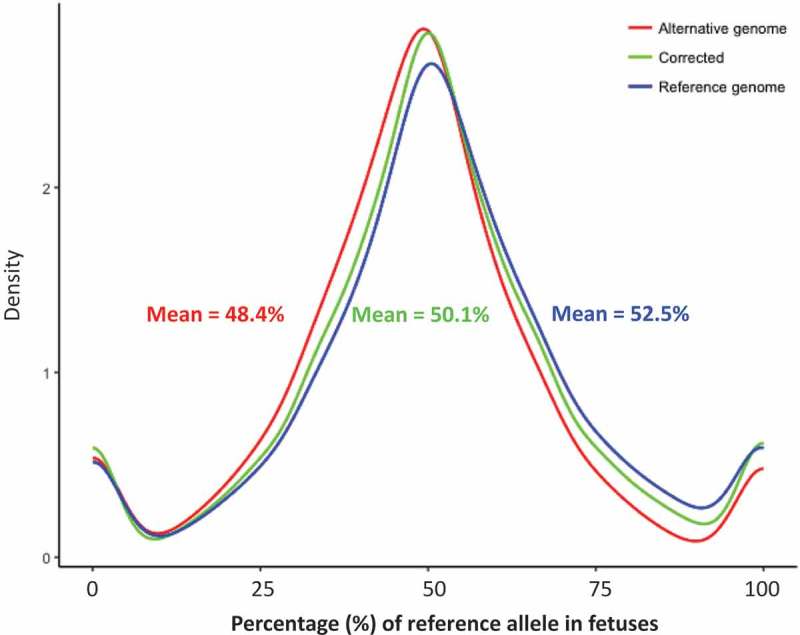
Correction of the RNA-seq alignment bias in the genome. Density plot of the percentage of reference allele’s read counts in the reference genome (blue), alternative genome (red), and after alignment bias correction (green).

Correction of the RNA-seq alignment bias in the genome. Density plot of the percentage of reference allele’s read counts in the reference genome (blue), alternative genome (red), and after alignment bias correction (green).