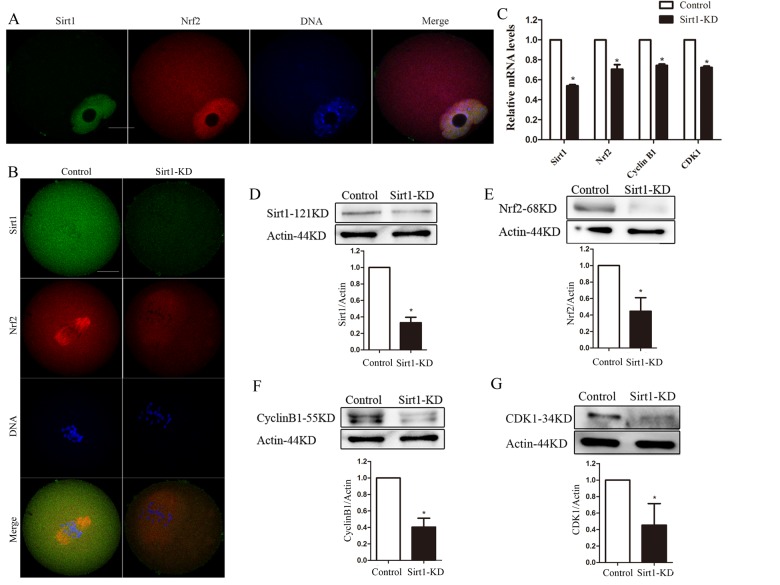
Figure 5.
Sirt1 depletion reduces Nrf2 expression in oocytes. (A) Double staining of GV oocytes with Nrf2 antibody (red) and Sirt1 antibody (green), and counterstaining of chromosome with Hoechst 33342 (blue), confirming the Sirt1 co-localization with Nrf2. (B) Control and Sirt1-KD oocytes were double stained with anti-Sirt1 antibody (green) and Nrf2 antibody (red), and counterstained for chromosomes (blue). (C) The relative mRNA levels of Sirt1, Nrf2, Cyclin B1 and CDK1 were determined by RT-qPCR in control- and Sirt1-siRNA-injected oocytes. mRNA levels in control oocytes were set to 1. (D) Reduced Sirt1 levels after Sirt1-siRNA injection were confirmed by western blot analysis. Actin served as a loading control. Band intensity was calculated using ImageJ. Bars represent the mean ± SD. *P<0.05 vs. control. (E-G) Western blot analysis showed the reduced Nrf2, Cyclin B1 and CDK1 protein levels in oocytes following Sirt1 knockdown, with actin as a loading control. Bars represent the mean ± SD. *P<0.05 vs. controls.

