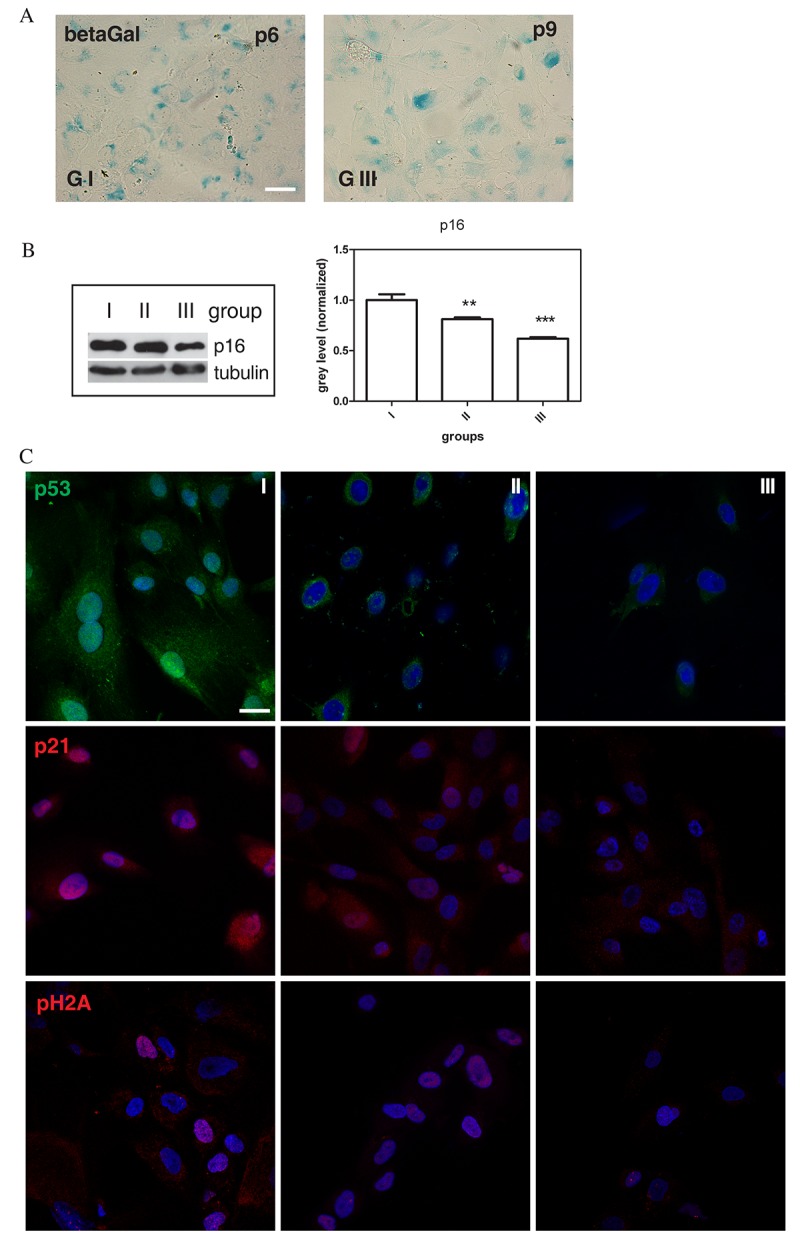
Figure 2.

Senescence-associated markers profile. (A) Representative images of beta-galactosidase assay performed in group I (faster senescent cells) and group III (slower senescent cells) samples at passage 6 and 9, respectively. Senescent cells are blue stained. Scale bar=30 µm. (B) Western Blot analysis of total hAFSCs lysates revealed with anti-p16 antibody. Tubulin detection was performed as a loading control. The graph shows densitometric analysis of Western Blot experiment. Group I samples were set as 1. Data are representative of three independent experiments (***P < 0.0001; **P < 0.01). (C) Representative confocal images of group I, II and III samples double staining with DAPI (blue) and p53 (green), p21 (red), pH2A (red). Scale bar= 10 µM
