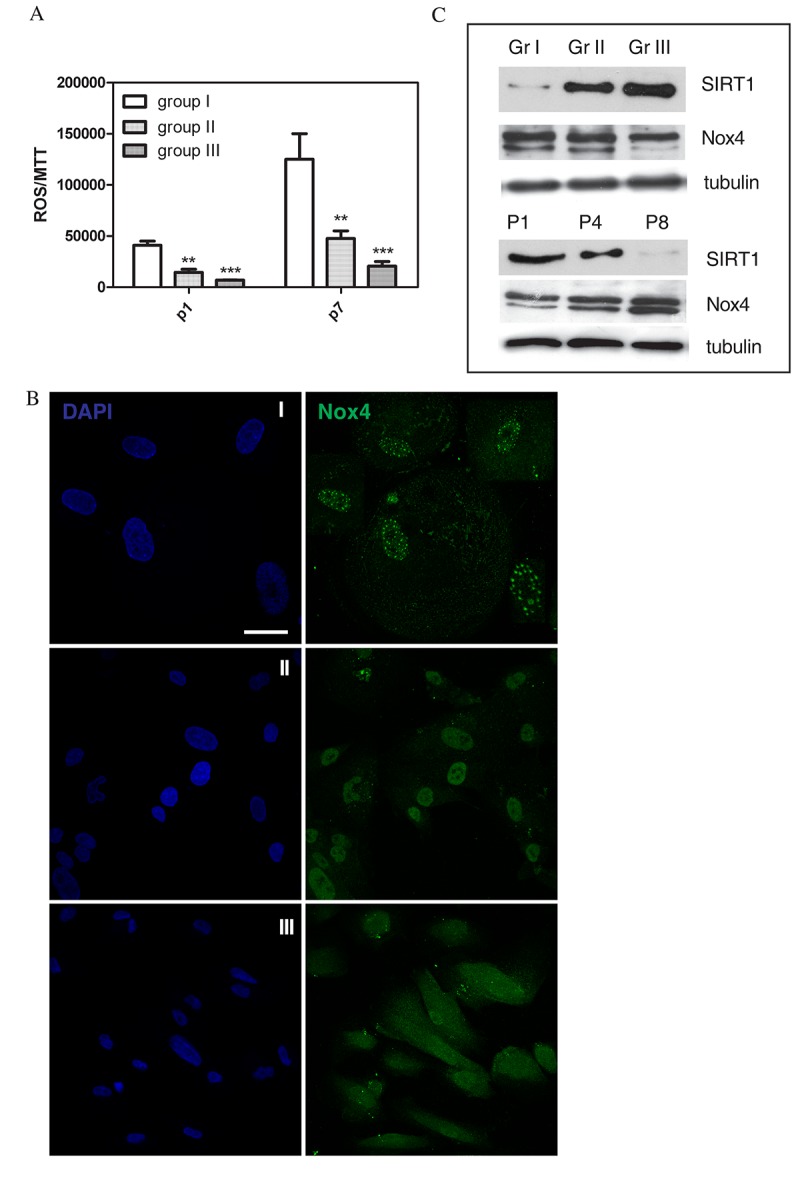
Figure 3.

ROS levels and ROS modulating proteins in AFSC groups. (A) Representative graph showing fluorescence, obtained with ROS probe (DCFH-DA), normalized to MTT viability values of hAFSCs samples at 1st and 7th culture passage. ***P < 0.0001; **P < 0.01 significantly different from group III. (B) Representative images showing DAPI (blue) and Nox4 (green) signals of the three different hAFSCs groups. Scale bar= 10 µm. (C) Representative images of Western blot analysis of AFSC samples, group I, II and III (Gr I-Gr III, faster to slower senescent cells) at passage 4, or group II at passage 1, 4 and 8 (P1-P8), revealed with anti-Sirt1 and anti-Nox4 antibody. Tubulin detection was performed as a loading control. Data are representative of three independent experiments.
