
Figure 5: Across-test overlap analyses between ensembles identified during different social behavior tests.
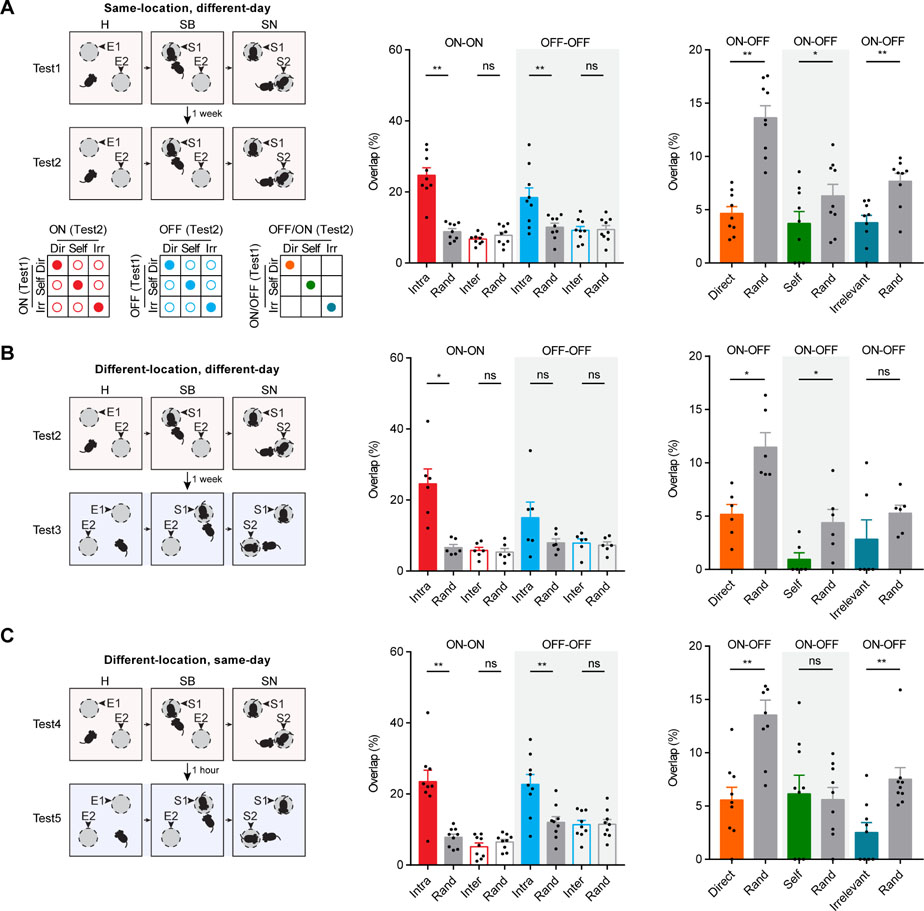
(A) Top left panel: schematic illustration of the two social behavior tests performed at different days with strangers presented at the same locations. Bottom left panels: illustrations for ON-ON intra- and inter-behavior overlap, OFF-OFF intra- and inter-behavior overlap, and ON-OFF intra-behavior overlap for each annotated behavior as indicated by colored circles. Middle panel: across-test ON-ON and OFF-OFF intra- and inter-behavior overlaps and those predicted by chance based on random selection, n = 9 mice. Right panel: across-test ON-OFF intra-behavior overlap and those predicted by chance based on random selection, n = 9 mice. (B) Overlap analysis for two social behavior tests performed at different days with strangers presented at different locations, n = 6 mice. (C) Overlap analysis for two social behavior tests performed on the same day with strangers presented at different locations, n = 9 mice. Data were represented as mean ± SEM. See also Figure S4, Figure S5 and Table S1.