
Figure 7. Acute PCP administration elicited deficits in social exploration and ensemble reorganization in the mPFC.
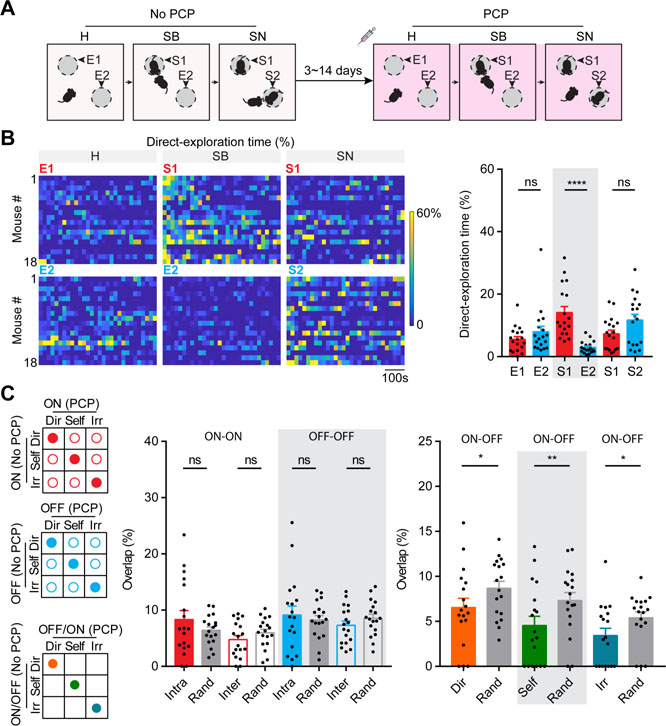
(A) Schematic illustration for social behavior tests performed in the absence and presence of PCP. H: habituation; SB: sociability; SN: social novelty. (B) Left panels: Raster plots for percentage of time (per 20 second bin) spent on direct-exploration toward different targets for individual mouse under acute PCP. Right panel shows the statistical results, n = 18 mice. (C) Ensemble overlap analyses between two social behavior tests performed in the absence and presence of PCP. Left panels: illustrations for ON-ON intra- and inter-behavior overlap (filled and unfilled red circles, respectively), OFF-OFF intra- and inter-behavior overlap (filled and unfilled blue circles, respectively), and ON-OFF intra-behavior overlap for each annotated behavior as indicated by colored circles. Middle panel: statistical results showing across-test ON-ON and OFF-OFF intra- and inter-behavior overlaps and those predicted by chance based on random selection, n = 18 mice. Right panel: statistical results showing across-test ON-OFF intra-behavior overlap and those predicted by chance based on random selection, n = 18 mice. Data were represented as mean ± SEM. See also Figure S6, Figure S7 and Table S1.