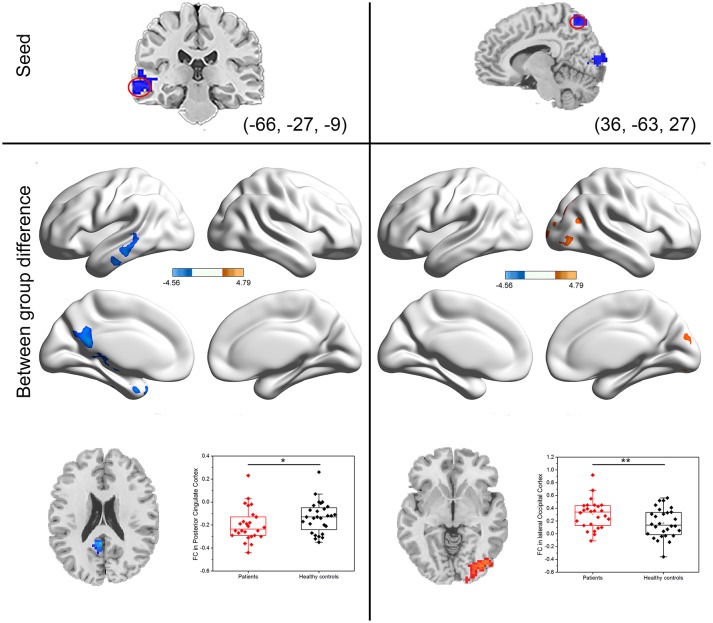
Figure 3.
Group differences in seed-based functional connectivity. The seeds were defined as left middle temporal gyrus and right precuneus. Scatter plot of FC for the significantly increased or decreased clusters between PI patients and healthy controls. Red dots: PI patients; black dots: healthy controls. Error bars represent standard deviation of the mean (*P < 0.05, **P < 0.001).

