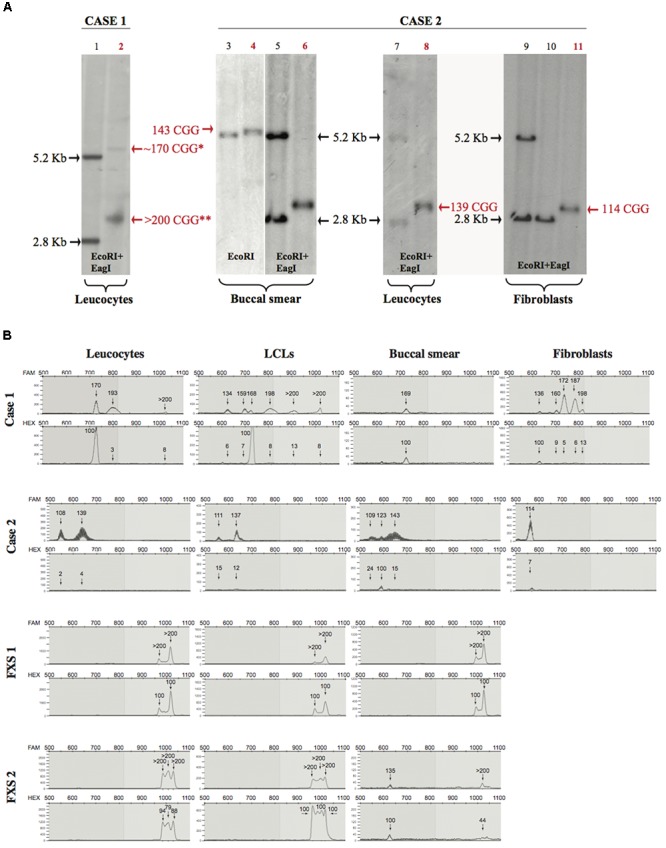
FIGURE 1.

Southern blot and mPCR analysis. (A) Southern blots of Case 1 and Case 2 (lane numbers for these samples are shown in red). Left panel (control in lane 1 and Case 1 in lane 2), analysis upon EcoRI-EagI DNA digestion from leucocytes. Right panels (controls in lanes 3, 5, 7, 9, 10 and Case 2 in lanes 4, 6, 8, 11) analysis upon EcoRI or EcoRI-EagI DNA digestion. Relative number of triplets is noted next to the bands; red text refers to number of triplets belonging to Case 1 and Case 2. ∗ is used to indicate a methylated premutation (lane 2), while two stars indicate the >200 CGG unmethylated allele. It is notable that, in Case 1 (lane 2), the 170 premutation allele is methylated while the expansion over 200 CGG (full mutation) is unmethylated; in Case 2, the methylated premutation allele of 123 repeats it is not detectable by Southern blot (lane 6 buccal smear). (B) Electropherograms representing CGG repetition alleles (top panel) and methylation percentages (bottom panel) relative to different tissues for Case 1, Case 2, FXS 1, and FXS 2 samples.
