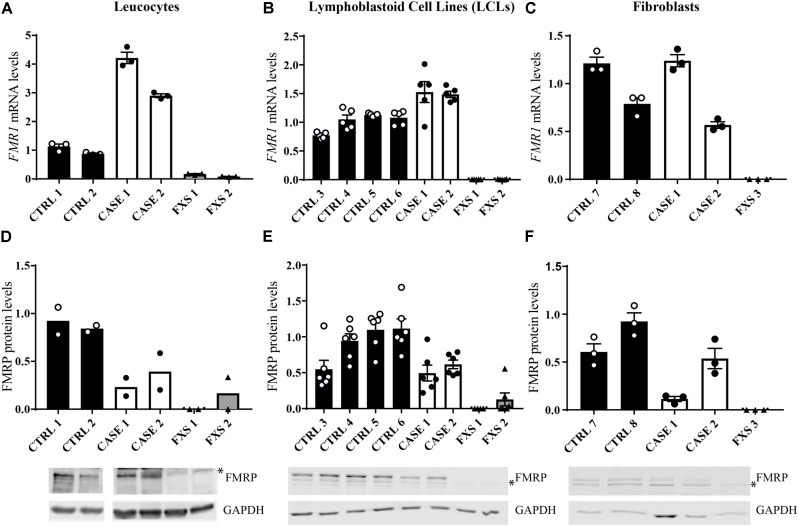
FIGURE 2.
Analysis of FMR1 mRNA and FMRP expression in different tissues. (A–C) Quantitative RT-qPCR detecting FMR1 mRNA relative expression in the tissues tested, normalized with the housekeeping HPRT1 mRNA [n = 3–5, technical replicates, independent experiments for (B,C)]. (D–F) Quantification of FMRP levels compared to GAPDH levels [n = 2–6 technical replicates, independent experiments for (E,F)]. The error bars indicate the standard error. Lower panels, representative Western blots from the different cell types analyzed. ∗ indicates a non-specific signal which has been subtracted in the quantification.

