FIGURE 2.
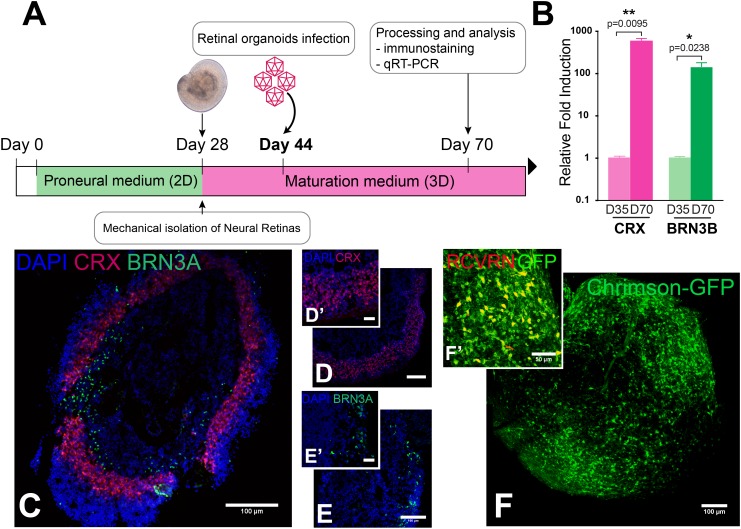
Characterization and transduction of retinal organoids derived from hiPSC. (A) Schematic of a 70-day optimized protocol of hiPSC differentiation toward retinal organoids. (B) CRX and BRN3B expression in qRT-PCR analysis. Mann–Whitney Student’s test relative to the expression on day 35 at least four biological replicates (N = 3) were used for each samples ∗∗p < 0.01, ∗p < 0.05 error bars show SEM. (C–E′) Representative immunostaining and magnification of a PR marker cone-rod homeobox CRX (red) (D,D′) and a retinal ganglion cell marker brain-specific homeobox BRN3A (green) (E,E′) in retinal organoid section. (F,F′) Representative in toto immunostaining toward ChrimsonR-GFP (green) (F) and the PR marker RCVRN (red) (F′) in retinal organoid. Scale bars = 100 μm (C–F); 30 μm (D′,E′); 50 μm (F′).

